
|
Nanning Chemical Industry Co., Ltd. (600301.SS) Avaliação DCF |
Totalmente Editável: Adapte-Se Às Suas Necessidades No Excel Ou Planilhas
Design Profissional: Modelos Confiáveis E Padrão Da Indústria
Pré-Construídos Para Uso Rápido E Eficiente
Compatível com MAC/PC, totalmente desbloqueado
Não É Necessária Experiência; Fácil De Seguir
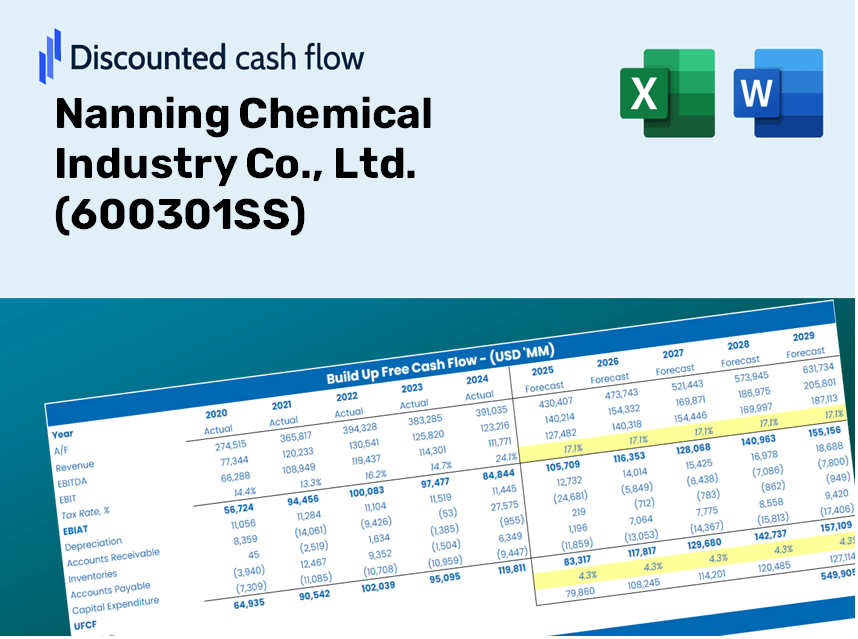
Nanning Chemical Industry Co., Ltd. (600301.SS) Bundle
Descubra o verdadeiro potencial da Nanning Chemical Industry Co., Ltd. (600301SS) com nossa calculadora DCF avançada! Ajuste as suposições cruciais, explore vários cenários e avalie os efeitos das mudanças na avaliação da Nanning Chemical Industry Co., Ltd. (600301SS) - tudo dentro de um único modelo do Excel.
Discounted Cash Flow (DCF) - (USD MM)
| Year | AY1 2020 |
AY2 2021 |
AY3 2022 |
AY4 2023 |
AY5 2024 |
FY1 2025 |
FY2 2026 |
FY3 2027 |
FY4 2028 |
FY5 2029 |
|---|---|---|---|---|---|---|---|---|---|---|
| Revenue | 902.9 | 394.2 | 2,767.1 | 3,200.8 | 4,630.9 | 5,835.2 | 7,352.6 | 9,264.6 | 11,673.8 | 14,709.5 |
| Revenue Growth, % | 0 | -56.34 | 601.88 | 15.67 | 44.68 | 26 | 26 | 26 | 26 | 26 |
| EBITDA | 38.6 | 46.3 | 781.6 | 1,032.6 | 1,562.0 | 1,286.7 | 1,621.4 | 2,043.0 | 2,574.2 | 3,243.6 |
| EBITDA, % | 4.27 | 11.74 | 28.25 | 32.26 | 33.73 | 22.05 | 22.05 | 22.05 | 22.05 | 22.05 |
| Depreciation | 3.0 | 3.9 | 180.0 | 247.5 | 262.5 | 247.8 | 312.2 | 393.4 | 495.7 | 624.6 |
| Depreciation, % | 0.33616 | 0.99218 | 6.5 | 7.73 | 5.67 | 4.25 | 4.25 | 4.25 | 4.25 | 4.25 |
| EBIT | 35.6 | 42.4 | 601.6 | 785.2 | 1,299.6 | 1,039.0 | 1,309.1 | 1,649.6 | 2,078.5 | 2,619.0 |
| EBIT, % | 3.94 | 10.75 | 21.74 | 24.53 | 28.06 | 17.81 | 17.81 | 17.81 | 17.81 | 17.81 |
| Total Cash | 364.3 | 139.8 | 152.5 | 917.7 | 1,174.6 | 1,579.6 | 1,990.4 | 2,507.9 | 3,160.1 | 3,981.9 |
| Total Cash, percent | .0 | .0 | .0 | .0 | .0 | .0 | .0 | .0 | .0 | .0 |
| Account Receivables | .0 | 115.4 | 84.7 | 178.4 | 172.3 | 485.7 | 612.0 | 771.2 | 971.7 | 1,224.4 |
| Account Receivables, % | 0 | 29.27 | 3.06 | 5.57 | 3.72 | 8.32 | 8.32 | 8.32 | 8.32 | 8.32 |
| Inventories | -73.9 | 159.3 | 149.5 | 370.4 | 718.3 | 755.1 | 951.5 | 1,199.0 | 1,510.7 | 1,903.6 |
| Inventories, % | -8.19 | 40.41 | 5.4 | 11.57 | 15.51 | 12.94 | 12.94 | 12.94 | 12.94 | 12.94 |
| Accounts Payable | 22.2 | 22.1 | 316.9 | 468.4 | 705.6 | 576.5 | 726.4 | 915.3 | 1,153.3 | 1,453.2 |
| Accounts Payable, % | 2.46 | 5.61 | 11.45 | 14.64 | 15.24 | 9.88 | 9.88 | 9.88 | 9.88 | 9.88 |
| Capital Expenditure | .0 | -7.9 | -3.4 | -93.7 | -114.0 | -87.6 | -110.4 | -139.2 | -175.3 | -220.9 |
| Capital Expenditure, % | -0.00419597 | -1.99 | -0.12411 | -2.93 | -2.46 | -1.5 | -1.5 | -1.5 | -1.5 | -1.5 |
| Tax Rate, % | 47.27 | 47.27 | 47.27 | 47.27 | 47.27 | 47.27 | 47.27 | 47.27 | 47.27 | 47.27 |
| EBITAT | 31.5 | 38.1 | 258.0 | 389.7 | 685.3 | 672.8 | 847.8 | 1,068.2 | 1,346.0 | 1,696.0 |
| Depreciation | ||||||||||
| Changes in Account Receivables | ||||||||||
| Changes in Inventories | ||||||||||
| Changes in Accounts Payable | ||||||||||
| Capital Expenditure | ||||||||||
| UFCF | 130.7 | -314.5 | 769.8 | 380.5 | 729.1 | 353.5 | 876.8 | 1,104.8 | 1,392.1 | 1,754.1 |
| WACC, % | 5.37 | 5.37 | 5.27 | 5.29 | 5.29 | 5.32 | 5.32 | 5.32 | 5.32 | 5.32 |
| PV UFCF | ||||||||||
| SUM PV UFCF | 4,557.0 | |||||||||
| Long Term Growth Rate, % | 4.00 | |||||||||
| Free cash flow (T + 1) | 1,824 | |||||||||
| Terminal Value | 138,317 | |||||||||
| Present Terminal Value | 106,744 | |||||||||
| Enterprise Value | 111,301 | |||||||||
| Net Debt | 49 | |||||||||
| Equity Value | 111,252 | |||||||||
| Diluted Shares Outstanding, MM | 632 | |||||||||
| Equity Value Per Share | 175.91 |
What You Will Receive
- Flexible Forecast Inputs: Effortlessly modify key assumptions (growth %, margins, WACC) to generate various scenarios.
- Industry-Specific Data: Nanning Chemical Industry Co., Ltd.'s (600301SS) financial information pre-loaded to facilitate your analysis.
- Automated DCF Calculations: The template computes the Net Present Value (NPV) and intrinsic value automatically.
- Tailored and Professional: A sleek Excel model that can be customized to suit your valuation requirements.
- Designed for Analysts and Investors: Perfect for assessing projections, confirming strategies, and increasing efficiency.
Key Features
- 🔍 Real-Life Nanning Chemical Financials: Pre-filled historical and projected data for Nanning Chemical Industry Co., Ltd. (600301SS).
- ✏️ Fully Customizable Inputs: Adjust all essential parameters (yellow cells) such as WACC, growth %, and tax rates.
- 📊 Professional DCF Valuation: Integrated formulas compute Nanning Chemical’s intrinsic value using the Discounted Cash Flow method.
- ⚡ Instant Results: View Nanning Chemical’s valuation immediately after making updates.
- Scenario Analysis: Evaluate and compare different outcomes based on various financial assumptions side-by-side.
How It Works
- Step 1: Download the Excel file.
- Step 2: Review pre-filled data for Nanning Chemical Industry Co., Ltd. (600301SS), including historical and projected figures.
- Step 3: Modify key assumptions (highlighted in yellow) according to your analysis.
- Step 4: Observe automatic recalculations for Nanning Chemical Industry Co., Ltd.'s (600301SS) intrinsic value.
- Step 5: Utilize the results for investment decisions or reporting purposes.
Why Choose Our Calculator for Nanning Chemical Industry Co., Ltd. (600301SS)?
- Precision: Utilizes accurate financial data specific to Nanning Chemical Industry.
- Adaptability: Tailored for users to easily adjust and experiment with various inputs.
- Efficiency: Eliminate the need to construct a DCF model from the ground up.
- Expert-Level: Crafted with the expertise and attention of industry professionals.
- Intuitive: Simple to navigate, even for those new to financial modeling.
Who Can Benefit from This Product?
- Chemical Engineering Students: Master analysis techniques and apply them to real-world data.
- Researchers: Utilize industry-standard models in your studies or publications.
- Investors: Evaluate your investment strategies and assess valuation scenarios for Nanning Chemical Industry Co., Ltd. (600301SS).
- Market Analysts: Enhance your efficiency with a tailored, user-friendly DCF model.
- Entrepreneurs: Discover how large chemical companies like Nanning Chemical Industry Co., Ltd. (600301SS) are evaluated in the market.
Overview of Template Components
- Preloaded Nanning Chemical Data: Historical and projected financial figures, including revenue, EBIT, and capital expenditures.
- DCF and WACC Models: Expert-level spreadsheets designed for computing intrinsic value and Weighted Average Cost of Capital.
- Editable Inputs: Cells highlighted in yellow to modify revenue growth, tax rates, and discount rates as needed.
- Financial Statements: Detailed annual and quarterly financial data for in-depth analysis.
- Key Ratios: Profitability, leverage, and efficiency ratios to assess company performance.
- Dashboard and Charts: Visual representations of valuation results and underlying assumptions.
Disclaimer
All information, articles, and product details provided on this website are for general informational and educational purposes only. We do not claim any ownership over, nor do we intend to infringe upon, any trademarks, copyrights, logos, brand names, or other intellectual property mentioned or depicted on this site. Such intellectual property remains the property of its respective owners, and any references here are made solely for identification or informational purposes, without implying any affiliation, endorsement, or partnership.
We make no representations or warranties, express or implied, regarding the accuracy, completeness, or suitability of any content or products presented. Nothing on this website should be construed as legal, tax, investment, financial, medical, or other professional advice. In addition, no part of this site—including articles or product references—constitutes a solicitation, recommendation, endorsement, advertisement, or offer to buy or sell any securities, franchises, or other financial instruments, particularly in jurisdictions where such activity would be unlawful.
All content is of a general nature and may not address the specific circumstances of any individual or entity. It is not a substitute for professional advice or services. Any actions you take based on the information provided here are strictly at your own risk. You accept full responsibility for any decisions or outcomes arising from your use of this website and agree to release us from any liability in connection with your use of, or reliance upon, the content or products found herein.