
|
Wanhua Chemical Group Co., Ltd. (600309.SS) Avaliação DCF |
Totalmente Editável: Adapte-Se Às Suas Necessidades No Excel Ou Planilhas
Design Profissional: Modelos Confiáveis E Padrão Da Indústria
Pré-Construídos Para Uso Rápido E Eficiente
Compatível com MAC/PC, totalmente desbloqueado
Não É Necessária Experiência; Fácil De Seguir
Wanhua Chemical Group Co., Ltd. (600309.SS) Bundle
Avalie as perspectivas financeiras da Wanhua Chemical Group Co., Ltd. Como um especialista! Esta calculadora DCF (600309SS) fornece financeiras pré-populadas e flexibilidade completa para modificar o crescimento da receita, o WACC, as margens e outras suposições essenciais para se alinhar às suas projeções.
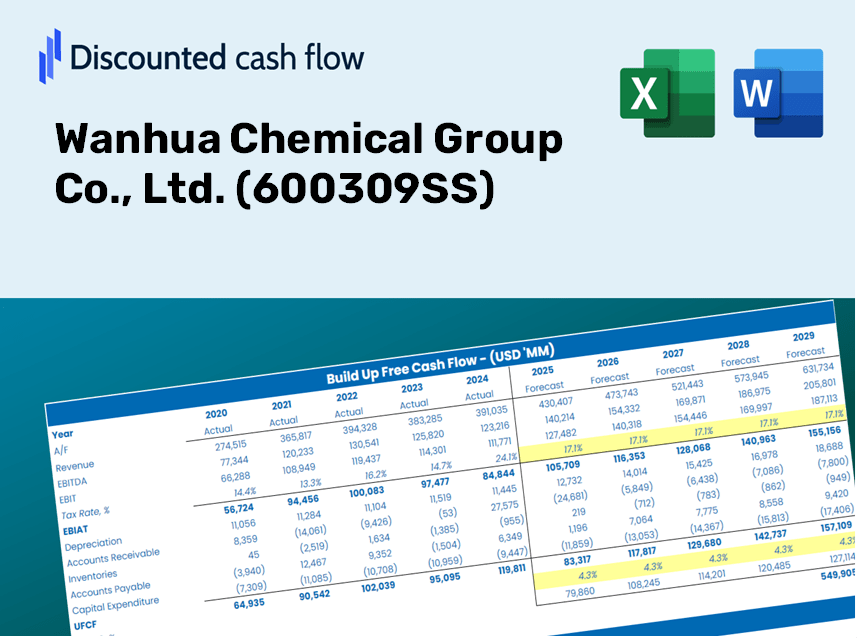
Discounted Cash Flow (DCF) - (USD MM)
| Year | AY1 2020 |
AY2 2021 |
AY3 2022 |
AY4 2023 |
AY5 2024 |
FY1 2025 |
FY2 2026 |
FY3 2027 |
FY4 2028 |
FY5 2029 |
|---|---|---|---|---|---|---|---|---|---|---|
| Revenue | 73,433.0 | 145,537.8 | 165,565.5 | 175,360.9 | 182,069.1 | 237,461.0 | 309,705.1 | 403,928.5 | 526,817.9 | 687,094.7 |
| Revenue Growth, % | 0 | 98.19 | 13.76 | 5.92 | 3.83 | 30.42 | 30.42 | 30.42 | 30.42 | 30.42 |
| EBITDA | 17,746.6 | 38,339.7 | 28,263.5 | 30,756.1 | 31,087.0 | 48,534.4 | 63,300.3 | 82,558.5 | 107,675.7 | 140,434.5 |
| EBITDA, % | 24.17 | 26.34 | 17.07 | 17.54 | 17.07 | 20.44 | 20.44 | 20.44 | 20.44 | 20.44 |
| Depreciation | 5,230.8 | 7,225.1 | 8,274.5 | 10,136.2 | 11,809.8 | 13,939.9 | 18,180.9 | 23,712.2 | 30,926.3 | 40,335.2 |
| Depreciation, % | 7.12 | 4.96 | 5 | 5.78 | 6.49 | 5.87 | 5.87 | 5.87 | 5.87 | 5.87 |
| EBIT | 12,515.8 | 31,114.6 | 19,989.0 | 20,619.9 | 19,277.2 | 34,594.5 | 45,119.4 | 58,846.3 | 76,749.4 | 100,099.3 |
| EBIT, % | 17.04 | 21.38 | 12.07 | 11.76 | 10.59 | 14.57 | 14.57 | 14.57 | 14.57 | 14.57 |
| Total Cash | 17,573.7 | 34,216.3 | 18,988.8 | 23,710.0 | 24,533.2 | 40,798.8 | 53,211.2 | 69,399.9 | 90,513.9 | 118,051.4 |
| Total Cash, percent | .0 | .0 | .0 | .0 | .0 | .0 | .0 | .0 | .0 | .0 |
| Account Receivables | 11,249.2 | 15,276.2 | 10,314.7 | .0 | 14,933.8 | 19,114.5 | 24,929.8 | 32,514.3 | 42,406.3 | 55,307.9 |
| Account Receivables, % | 15.32 | 10.5 | 6.23 | 0 | 8.2 | 8.05 | 8.05 | 8.05 | 8.05 | 8.05 |
| Inventories | 8,703.5 | 18,282.0 | 18,185.3 | 20,650.1 | 24,107.3 | 28,692.1 | 37,421.3 | 48,806.1 | 63,654.7 | 83,020.7 |
| Inventories, % | 11.85 | 12.56 | 10.98 | 11.78 | 13.24 | 12.08 | 12.08 | 12.08 | 12.08 | 12.08 |
| Accounts Payable | 6,847.5 | 20,390.0 | 13,066.5 | 45,593.7 | 69,136.1 | 45,212.3 | 58,967.5 | 76,907.5 | 100,305.5 | 130,822.0 |
| Accounts Payable, % | 9.32 | 14.01 | 7.89 | 26 | 37.97 | 19.04 | 19.04 | 19.04 | 19.04 | 19.04 |
| Capital Expenditure | -23,235.7 | -26,999.6 | -32,656.6 | -43,098.4 | -35,830.1 | -54,223.9 | -70,720.7 | -92,236.5 | -120,298.1 | -156,897.0 |
| Capital Expenditure, % | -31.64 | -18.55 | -19.72 | -24.58 | -19.68 | -22.83 | -22.83 | -22.83 | -22.83 | -22.83 |
| Tax Rate, % | 22.99 | 22.99 | 22.99 | 22.99 | 22.99 | 22.99 | 22.99 | 22.99 | 22.99 | 22.99 |
| EBITAT | 10,712.1 | 26,308.7 | 16,606.1 | 17,328.4 | 14,845.2 | 28,662.6 | 37,382.8 | 48,755.9 | 63,589.2 | 82,935.3 |
| Depreciation | ||||||||||
| Changes in Account Receivables | ||||||||||
| Changes in Inventories | ||||||||||
| Changes in Accounts Payable | ||||||||||
| Capital Expenditure | ||||||||||
| UFCF | -20,398.0 | 6,471.1 | -10,041.2 | 24,743.3 | -4,023.7 | -44,310.7 | -15,946.3 | -20,797.7 | -27,125.1 | -35,377.6 |
| WACC, % | 5.4 | 5.38 | 5.37 | 5.38 | 5.3 | 5.36 | 5.36 | 5.36 | 5.36 | 5.36 |
| PV UFCF | ||||||||||
| SUM PV UFCF | -123,450.1 | |||||||||
| Long Term Growth Rate, % | 3.00 | |||||||||
| Free cash flow (T + 1) | -36,439 | |||||||||
| Terminal Value | -1,541,019 | |||||||||
| Present Terminal Value | -1,186,682 | |||||||||
| Enterprise Value | -1,310,132 | |||||||||
| Net Debt | 69,110 | |||||||||
| Equity Value | -1,379,242 | |||||||||
| Diluted Shares Outstanding, MM | 3,140 | |||||||||
| Equity Value Per Share | -439.18 |
What You Will Receive
- Authentic Wanhua Financials: Provides both historical and projected data for precise valuation.
- Customizable Parameters: Adjust WACC, tax rates, revenue growth, and capital expenditures as needed.
- Automated Calculations: Intrinsic value and NPV are computed in real-time.
- Scenario Exploration: Analyze various scenarios to assess the future outlook of Wanhua Chemical Group (600309SS).
- User-Friendly Interface: Designed for professionals while remaining approachable for beginners.
Key Features
- Pre-Loaded Data: Wanhua Chemical's historical financial statements and pre-filled forecasts.
- Fully Adjustable Inputs: Modify WACC, tax rates, revenue growth, and EBITDA margins as needed.
- Instant Results: Observe the recalculation of Wanhua Chemical's intrinsic value in real-time.
- Clear Visual Outputs: Dashboard charts provide a visual representation of valuation results and key metrics.
- Built for Accuracy: A professional-grade tool designed for analysts, investors, and finance specialists.
How It Operates
- Step 1: Download the prebuilt Excel template featuring Wanhua Chemical Group's data.
- Step 2: Navigate through the pre-filled sheets to familiarize yourself with the key metrics.
- Step 3: Modify forecasts and assumptions in the editable yellow cells (WACC, growth rates, profit margins).
- Step 4: Instantly view updated results, including the intrinsic value of Wanhua Chemical Group (600309SS).
- Step 5: Use the output to make well-informed investment decisions or compile reports.
Why Opt for This Calculator?
- Designed for Experts: A sophisticated tool tailored for analysts, CFOs, and consultants.
- Up-to-Date Data: Wanhua Chemical's historical and forecasted financials preloaded for precision.
- Scenario Analysis: Effortlessly simulate various projections and assumptions.
- Clear Results: Automatically computes intrinsic value, NPV, and essential metrics.
- User-Friendly: Comprehensive step-by-step guidance to facilitate the process.
Who Can Benefit from Wanhua Chemical Group Co., Ltd. (600309SS)?
- Investors: Make informed choices with our advanced valuation tool tailored for Wanhua Chemical Group Co., Ltd. (600309SS).
- Financial Analysts: Streamline your analysis with a customizable DCF model specifically designed for Wanhua Chemical Group Co., Ltd. (600309SS).
- Consultants: Effortlessly modify our template for presentations or reports focused on Wanhua Chemical Group Co., Ltd. (600309SS).
- Finance Enthusiasts: Enhance your knowledge of valuation methods through real-life applications related to Wanhua Chemical Group Co., Ltd. (600309SS).
- Educators and Students: Utilize our product as a hands-on learning resource in finance courses centered on Wanhua Chemical Group Co., Ltd. (600309SS).
Overview of Template Contents
- Pre-Filled DCF Model: Wanhua Chemical's financial data ready for instant analysis.
- WACC Calculator: Comprehensive calculations for Weighted Average Cost of Capital.
- Financial Ratios: Assess Wanhua Chemical's profitability, leverage, and operational efficiency.
- Editable Inputs: Adjust key assumptions like growth rates, profit margins, and capital expenditures to tailor your projections.
- Financial Statements: Access annual and quarterly reports for in-depth analysis.
- Interactive Dashboard: Effortlessly visualize essential valuation metrics and outcomes.
Disclaimer
All information, articles, and product details provided on this website are for general informational and educational purposes only. We do not claim any ownership over, nor do we intend to infringe upon, any trademarks, copyrights, logos, brand names, or other intellectual property mentioned or depicted on this site. Such intellectual property remains the property of its respective owners, and any references here are made solely for identification or informational purposes, without implying any affiliation, endorsement, or partnership.
We make no representations or warranties, express or implied, regarding the accuracy, completeness, or suitability of any content or products presented. Nothing on this website should be construed as legal, tax, investment, financial, medical, or other professional advice. In addition, no part of this site—including articles or product references—constitutes a solicitation, recommendation, endorsement, advertisement, or offer to buy or sell any securities, franchises, or other financial instruments, particularly in jurisdictions where such activity would be unlawful.
All content is of a general nature and may not address the specific circumstances of any individual or entity. It is not a substitute for professional advice or services. Any actions you take based on the information provided here are strictly at your own risk. You accept full responsibility for any decisions or outcomes arising from your use of this website and agree to release us from any liability in connection with your use of, or reliance upon, the content or products found herein.