
|
Henan Pinggao Electric Co., Ltd. (600312.SS) Avaliação do DCF |
Totalmente Editável: Adapte-Se Às Suas Necessidades No Excel Ou Planilhas
Design Profissional: Modelos Confiáveis E Padrão Da Indústria
Pré-Construídos Para Uso Rápido E Eficiente
Compatível com MAC/PC, totalmente desbloqueado
Não É Necessária Experiência; Fácil De Seguir
Henan Pinggao Electric Co.,Ltd. (600312.SS) Bundle
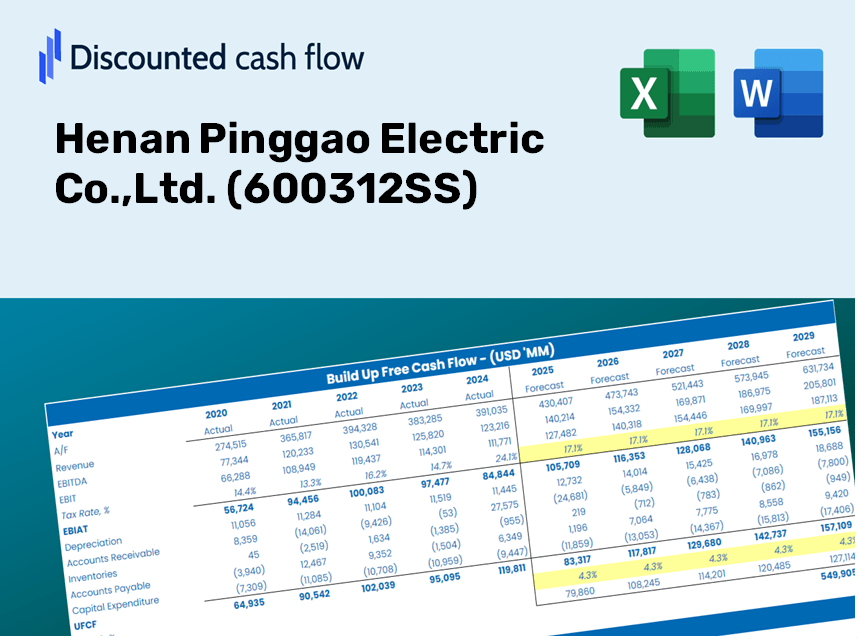
Obtenha informações sobre sua Henan Pinggao Electric Co., Ltd. (600312Ss) Análise de avaliação com nossa calculadora DCF de última geração! Pré -carregado com dados reais (600312Ss), este modelo do Excel permite ajustar as previsões e suposições para determinar com precisão o valor intrínseco da Henan Pinggao Electric Co., Ltd.
Discounted Cash Flow (DCF) - (USD MM)
| Year | AY1 2020 |
AY2 2021 |
AY3 2022 |
AY4 2023 |
AY5 2024 |
FY1 2025 |
FY2 2026 |
FY3 2027 |
FY4 2028 |
FY5 2029 |
|---|---|---|---|---|---|---|---|---|---|---|
| Revenue | 9,781.1 | 9,273.3 | 9,274.3 | 11,077.0 | 12,401.6 | 13,214.4 | 14,080.4 | 15,003.2 | 15,986.5 | 17,034.3 |
| Revenue Growth, % | 0 | -5.19 | 0.0104167 | 19.44 | 11.96 | 6.55 | 6.55 | 6.55 | 6.55 | 6.55 |
| EBITDA | 714.5 | 719.0 | 745.7 | 1,311.5 | 1,569.2 | 1,257.8 | 1,340.2 | 1,428.1 | 1,521.7 | 1,621.4 |
| EBITDA, % | 7.31 | 7.75 | 8.04 | 11.84 | 12.65 | 9.52 | 9.52 | 9.52 | 9.52 | 9.52 |
| Depreciation | 414.8 | 482.6 | 458.2 | 383.7 | 362.3 | 548.9 | 584.9 | 623.2 | 664.1 | 707.6 |
| Depreciation, % | 4.24 | 5.2 | 4.94 | 3.46 | 2.92 | 4.15 | 4.15 | 4.15 | 4.15 | 4.15 |
| EBIT | 299.8 | 236.4 | 287.5 | 927.8 | 1,206.9 | 708.9 | 755.3 | 804.8 | 857.6 | 913.8 |
| EBIT, % | 3.06 | 2.55 | 3.1 | 8.38 | 9.73 | 5.36 | 5.36 | 5.36 | 5.36 | 5.36 |
| Total Cash | 2,338.6 | 2,774.3 | 3,496.6 | 5,001.5 | 7,129.6 | 5,131.7 | 5,468.0 | 5,826.3 | 6,208.2 | 6,615.1 |
| Total Cash, percent | .0 | .0 | .0 | .0 | .0 | .0 | .0 | .0 | .0 | .0 |
| Account Receivables | 9,245.9 | 8,141.0 | 6,586.9 | 7,833.6 | 7,220.0 | 10,103.2 | 10,765.3 | 11,470.9 | 12,222.7 | 13,023.7 |
| Account Receivables, % | 94.53 | 87.79 | 71.02 | 70.72 | 58.22 | 76.46 | 76.46 | 76.46 | 76.46 | 76.46 |
| Inventories | 1,880.2 | 1,751.1 | 1,516.8 | 1,426.2 | 1,547.3 | 2,109.3 | 2,247.6 | 2,394.9 | 2,551.8 | 2,719.1 |
| Inventories, % | 19.22 | 18.88 | 16.35 | 12.88 | 12.48 | 15.96 | 15.96 | 15.96 | 15.96 | 15.96 |
| Accounts Payable | 8,407.2 | 6,711.4 | 6,119.0 | 7,438.3 | 5,212.0 | 8,813.6 | 9,391.2 | 10,006.7 | 10,662.5 | 11,361.3 |
| Accounts Payable, % | 85.95 | 72.37 | 65.98 | 67.15 | 42.03 | 66.7 | 66.7 | 66.7 | 66.7 | 66.7 |
| Capital Expenditure | -72.1 | -99.4 | -69.4 | -112.6 | -187.5 | -134.4 | -143.2 | -152.6 | -162.6 | -173.3 |
| Capital Expenditure, % | -0.73709 | -1.07 | -0.74851 | -1.02 | -1.51 | -1.02 | -1.02 | -1.02 | -1.02 | -1.02 |
| Tax Rate, % | 19.64 | 19.64 | 19.64 | 19.64 | 19.64 | 19.64 | 19.64 | 19.64 | 19.64 | 19.64 |
| EBITAT | 185.8 | 125.8 | 184.9 | 755.0 | 969.9 | 483.8 | 515.5 | 549.3 | 585.3 | 623.6 |
| Depreciation | ||||||||||
| Changes in Account Receivables | ||||||||||
| Changes in Inventories | ||||||||||
| Changes in Accounts Payable | ||||||||||
| Capital Expenditure | ||||||||||
| UFCF | -2,190.4 | 47.2 | 1,769.6 | 1,189.3 | -589.1 | 1,054.6 | 734.4 | 782.5 | 833.8 | 888.5 |
| WACC, % | 6.43 | 6.42 | 6.43 | 6.44 | 6.44 | 6.43 | 6.43 | 6.43 | 6.43 | 6.43 |
| PV UFCF | ||||||||||
| SUM PV UFCF | 3,588.8 | |||||||||
| Long Term Growth Rate, % | 3.50 | |||||||||
| Free cash flow (T + 1) | 920 | |||||||||
| Terminal Value | 31,377 | |||||||||
| Present Terminal Value | 22,976 | |||||||||
| Enterprise Value | 26,565 | |||||||||
| Net Debt | -7,086 | |||||||||
| Equity Value | 33,651 | |||||||||
| Diluted Shares Outstanding, MM | 1,357 | |||||||||
| Equity Value Per Share | 24.80 |
What You Will Receive
- Comprehensive Financial Model: Leverage Henan Pinggao Electric Co., Ltd.'s actual data for accurate DCF valuation.
- Complete Forecast Control: Modify revenue growth rates, profit margins, WACC, and other essential variables.
- Real-Time Calculations: Automatic updates provide instant visibility into your results as modifications are made.
- Professional-Grade Template: A polished Excel file crafted for high-quality financial valuation.
- Flexible and Reusable: Designed for adaptability, enabling repeated applications for thorough forecasts.
Key Features
- Customizable Forecast Inputs: Adjust essential metrics such as revenue growth, EBITDA percentage, and capital expenditures.
- Instant DCF Valuation: Automatically computes intrinsic value, NPV, and other financial metrics in real-time.
- High-Precision Accuracy: Leverages Henan Pinggao Electric's (600312SS) actual financial data for precise valuation results.
- Effortless Scenario Analysis: Evaluate alternative assumptions and easily compare results.
- Time-Efficient Solution: Remove the hassle of constructing intricate valuation models from the ground up.
How It Functions
- Step 1: Download the prebuilt Excel template featuring Henan Pinggao Electric Co., Ltd.'s data included.
- Step 2: Navigate through the pre-filled sheets to familiarize yourself with the key metrics.
- Step 3: Modify forecasts and assumptions in the editable yellow cells (WACC, growth, margins).
- Step 4: Instantly view updated results, including Henan Pinggao Electric Co., Ltd.'s intrinsic value.
- Step 5: Make informed investment choices or generate reports based on the outputs.
Why Choose This Calculator for Henan Pinggao Electric Co., Ltd. (600312SS)?
- All-in-One Solution: Combines DCF, WACC, and financial ratio evaluations into a single, powerful tool.
- Flexible Inputs: Modify the yellow-highlighted fields to explore various financial scenarios.
- In-Depth Analysis: Automatically determines Henan Pinggao Electric's intrinsic value and Net Present Value.
- Preloaded Information: Access historical and projected data for reliable analysis.
- High-Quality Standards: Perfect for financial analysts, investors, and business consultants focusing on (600312SS).
Who Should Consider Using This Product?
- Individual Investors: Gain valuable insights for making informed decisions about trading Henan Pinggao Electric Co., Ltd. (600312SS).
- Financial Analysts: Enhance valuation methodologies with ready-to-implement financial models tailored for the electric industry.
- Consultants: Provide clients with accurate and swift valuation analyses for Henan Pinggao Electric Co., Ltd. (600312SS).
- Business Owners: Learn how major firms like Henan Pinggao Electric Co., Ltd. (600312SS) are valued to inform your own business strategy.
- Finance Students: Explore valuation techniques utilizing real-world data and scenarios, including insights from Henan Pinggao Electric Co., Ltd. (600312SS).
Contents of the Template
- Comprehensive DCF Model: An editable template featuring in-depth valuation calculations.
- Real-World Data: Historical and projected financials for Henan Pinggao Electric Co., Ltd. (600312SS) included for your analysis.
- Customizable Parameters: Modify WACC, growth rates, and tax assumptions to explore various scenarios.
- Financial Statements: Complete annual and quarterly financial breakdowns for enhanced insights.
- Key Ratios: Integrated analysis tools for assessing profitability, efficiency, and financial leverage.
- Dashboard with Visual Outputs: Intuitive charts and tables presenting clear, actionable results.
Disclaimer
All information, articles, and product details provided on this website are for general informational and educational purposes only. We do not claim any ownership over, nor do we intend to infringe upon, any trademarks, copyrights, logos, brand names, or other intellectual property mentioned or depicted on this site. Such intellectual property remains the property of its respective owners, and any references here are made solely for identification or informational purposes, without implying any affiliation, endorsement, or partnership.
We make no representations or warranties, express or implied, regarding the accuracy, completeness, or suitability of any content or products presented. Nothing on this website should be construed as legal, tax, investment, financial, medical, or other professional advice. In addition, no part of this site—including articles or product references—constitutes a solicitation, recommendation, endorsement, advertisement, or offer to buy or sell any securities, franchises, or other financial instruments, particularly in jurisdictions where such activity would be unlawful.
All content is of a general nature and may not address the specific circumstances of any individual or entity. It is not a substitute for professional advice or services. Any actions you take based on the information provided here are strictly at your own risk. You accept full responsibility for any decisions or outcomes arising from your use of this website and agree to release us from any liability in connection with your use of, or reliance upon, the content or products found herein.