
|
Tianjin Pharmaceutical Da Ren Tang Group Corporation Limited (600329.SS) Avaliação DCF |
Totalmente Editável: Adapte-Se Às Suas Necessidades No Excel Ou Planilhas
Design Profissional: Modelos Confiáveis E Padrão Da Indústria
Pré-Construídos Para Uso Rápido E Eficiente
Compatível com MAC/PC, totalmente desbloqueado
Não É Necessária Experiência; Fácil De Seguir
Tianjin Pharmaceutical Da Ren Tang Group Corporation Limited (600329.SS) Bundle
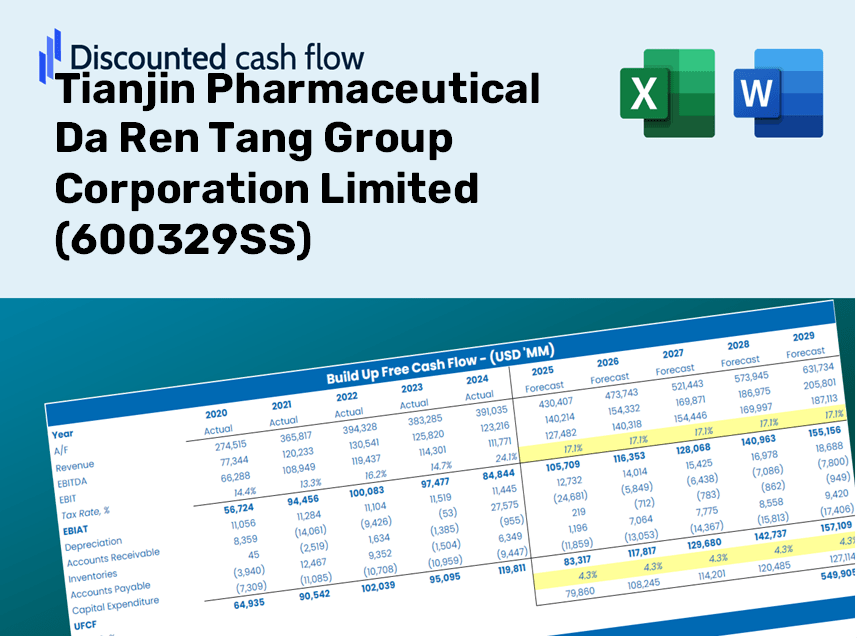
Seja você um investidor ou analista, essa calculadora (600329SS) DCF é o recurso ideal para uma avaliação precisa. Carregado com dados reais da Tianjin Pharmaceutical Da Ren Tang Group Corporation Limited, você pode ajustar as previsões e observar instantaneamente os efeitos.
Discounted Cash Flow (DCF) - (USD MM)
| Year | AY1 2020 |
AY2 2021 |
AY3 2022 |
AY4 2023 |
AY5 2024 |
FY1 2025 |
FY2 2026 |
FY3 2027 |
FY4 2028 |
FY5 2029 |
|---|---|---|---|---|---|---|---|---|---|---|
| Revenue | 6,603.7 | 6,907.5 | 8,249.2 | 8,222.3 | 7,306.7 | 7,536.2 | 7,772.9 | 8,017.1 | 8,268.9 | 8,528.6 |
| Revenue Growth, % | 0 | 4.6 | 19.42 | -0.32655 | -11.14 | 3.14 | 3.14 | 3.14 | 3.14 | 3.14 |
| EBITDA | 660.9 | 701.3 | 786.1 | 947.7 | 893.2 | 805.5 | 830.8 | 856.9 | 883.8 | 911.5 |
| EBITDA, % | 10.01 | 10.15 | 9.53 | 11.53 | 12.22 | 10.69 | 10.69 | 10.69 | 10.69 | 10.69 |
| Depreciation | 109.9 | 114.3 | 114.8 | 126.6 | 119.1 | 118.8 | 122.5 | 126.4 | 130.3 | 134.4 |
| Depreciation, % | 1.66 | 1.65 | 1.39 | 1.54 | 1.63 | 1.58 | 1.58 | 1.58 | 1.58 | 1.58 |
| EBIT | 551.0 | 587.0 | 671.3 | 821.0 | 774.0 | 686.7 | 708.3 | 730.5 | 753.5 | 777.1 |
| EBIT, % | 8.34 | 8.5 | 8.14 | 9.99 | 10.59 | 9.11 | 9.11 | 9.11 | 9.11 | 9.11 |
| Total Cash | 1,987.3 | 2,283.2 | 2,882.5 | 2,145.5 | 3,944.5 | 2,685.4 | 2,769.8 | 2,856.8 | 2,946.5 | 3,039.1 |
| Total Cash, percent | .0 | .0 | .0 | .0 | .0 | .0 | .0 | .0 | .0 | .0 |
| Account Receivables | 2,007.4 | 2,011.3 | 2,785.1 | 2,653.1 | 1,324.9 | 2,165.6 | 2,233.6 | 2,303.8 | 2,376.1 | 2,450.7 |
| Account Receivables, % | 30.4 | 29.12 | 33.76 | 32.27 | 18.13 | 28.74 | 28.74 | 28.74 | 28.74 | 28.74 |
| Inventories | 1,487.7 | 1,525.1 | 1,429.5 | 1,566.5 | 1,285.7 | 1,485.9 | 1,532.6 | 1,580.7 | 1,630.4 | 1,681.6 |
| Inventories, % | 22.53 | 22.08 | 17.33 | 19.05 | 17.6 | 19.72 | 19.72 | 19.72 | 19.72 | 19.72 |
| Accounts Payable | 902.3 | 1,242.5 | 1,405.9 | 1,126.1 | 284.5 | 999.0 | 1,030.4 | 1,062.8 | 1,096.2 | 1,130.6 |
| Accounts Payable, % | 13.66 | 17.99 | 17.04 | 13.7 | 3.89 | 13.26 | 13.26 | 13.26 | 13.26 | 13.26 |
| Capital Expenditure | -189.2 | -156.9 | -107.9 | -140.9 | -117.8 | -147.3 | -151.9 | -156.7 | -161.6 | -166.7 |
| Capital Expenditure, % | -2.86 | -2.27 | -1.31 | -1.71 | -1.61 | -1.95 | -1.95 | -1.95 | -1.95 | -1.95 |
| Tax Rate, % | 13.55 | 13.55 | 13.55 | 13.55 | 13.55 | 13.55 | 13.55 | 13.55 | 13.55 | 13.55 |
| EBITAT | 474.7 | 517.3 | 590.2 | 739.6 | 669.2 | 602.5 | 621.5 | 641.0 | 661.1 | 681.9 |
| Depreciation | ||||||||||
| Changes in Account Receivables | ||||||||||
| Changes in Inventories | ||||||||||
| Changes in Accounts Payable | ||||||||||
| Capital Expenditure | ||||||||||
| UFCF | -2,197.5 | 773.6 | 82.4 | 440.5 | 1,437.9 | 247.7 | 508.8 | 524.7 | 541.2 | 558.2 |
| WACC, % | 7.43 | 7.44 | 7.44 | 7.44 | 7.43 | 7.44 | 7.44 | 7.44 | 7.44 | 7.44 |
| PV UFCF | ||||||||||
| SUM PV UFCF | 1,890.7 | |||||||||
| Long Term Growth Rate, % | 3.50 | |||||||||
| Free cash flow (T + 1) | 578 | |||||||||
| Terminal Value | 14,679 | |||||||||
| Present Terminal Value | 10,255 | |||||||||
| Enterprise Value | 12,146 | |||||||||
| Net Debt | -2,917 | |||||||||
| Equity Value | 15,063 | |||||||||
| Diluted Shares Outstanding, MM | 771 | |||||||||
| Equity Value Per Share | 19.53 |
What You'll Receive
- Comprehensive Financial Model: Leverage Tianjin Pharmaceutical Da Ren Tang Group Corporation Limited’s actual data for accurate DCF valuation.
- Complete Forecast Control: Modify revenue growth, profit margins, WACC, and other essential factors effortlessly.
- Real-Time Calculations: Immediate updates guarantee that you see outcomes as you implement changes.
- Professional-Grade Template: A polished Excel file created for high-quality valuation purposes.
- Flexible and Reusable: Designed for adaptability, allowing for repeated use in detailed forecasting.
Key Features
- Authentic Financial Data: Gain access to reliable, pre-loaded historical figures and future forecasts for Tianjin Pharmaceutical Da Ren Tang Group Corporation Limited (600329SS).
- Adjustable Forecast Parameters: Modify yellow-highlighted cells, including WACC, growth rates, and profit margins to suit your analysis.
- Real-Time Calculations: Automatic updates to DCF, Net Present Value (NPV), and cash flow assessments.
- Interactive Dashboard: User-friendly charts and summaries to better illustrate your valuation findings.
- Designed for All Users: An intuitive layout tailored for investors, CFOs, and consultants, whether experienced or new.
How It Works
- Step 1: Download the Excel file.
- Step 2: Review Tianjin Pharmaceutical Da Ren Tang Group Corporation Limited's [600329SS] pre-filled financial data and forecasts.
- Step 3: Adjust key inputs such as revenue growth, WACC, and tax rates (highlighted cells).
- Step 4: Observe the DCF model refresh in real-time as you modify your assumptions.
- Step 5: Evaluate the results and utilize them for your investment strategies.
Why Opt for This Calculator?
- Time-Saving: Skip the hassle of building a DCF model from the ground up – it’s ready for immediate use.
- Enhanced Precision: Dependable financial data and formulas minimize valuation errors.
- Completely Customizable: Adapt the model to suit your specific assumptions and forecasts.
- Simple to Understand: Intuitive charts and outputs facilitate straightforward analysis of results.
- Endorsed by Professionals: Crafted for experts at Tianjin Pharmaceutical Da Ren Tang Group Corporation Limited (600329SS) who prioritize accuracy and ease of use.
Who Can Benefit from This Product?
- Investors: Gain confidence in your investment choices with our advanced valuation tool.
- Financial Analysts: Increase efficiency with our customizable, ready-to-use DCF model.
- Consultants: Easily tailor the template for client presentations and reports.
- Finance Enthusiasts: Expand your knowledge of valuation methods with practical, real-world scenarios.
- Educators and Students: Utilize it as a hands-on resource for finance coursework.
Contents of the Template
- Historical Data: Covers past financials and baseline forecasts for Tianjin Pharmaceutical Da Ren Tang Group Corporation Limited (600329SS).
- DCF and Levered DCF Models: Comprehensive templates designed to assess the intrinsic value of Tianjin Pharmaceutical Da Ren Tang Group Corporation Limited (600329SS).
- WACC Sheet: Preconfigured calculations for the Weighted Average Cost of Capital.
- Editable Inputs: Adjust critical drivers such as growth rates, EBITDA percentages, and CAPEX assumptions.
- Quarterly and Annual Statements: In-depth analysis of Tianjin Pharmaceutical Da Ren Tang Group Corporation Limited (600329SS) financials.
- Interactive Dashboard: Dynamically visualize valuation outcomes and forecasts.
Disclaimer
All information, articles, and product details provided on this website are for general informational and educational purposes only. We do not claim any ownership over, nor do we intend to infringe upon, any trademarks, copyrights, logos, brand names, or other intellectual property mentioned or depicted on this site. Such intellectual property remains the property of its respective owners, and any references here are made solely for identification or informational purposes, without implying any affiliation, endorsement, or partnership.
We make no representations or warranties, express or implied, regarding the accuracy, completeness, or suitability of any content or products presented. Nothing on this website should be construed as legal, tax, investment, financial, medical, or other professional advice. In addition, no part of this site—including articles or product references—constitutes a solicitation, recommendation, endorsement, advertisement, or offer to buy or sell any securities, franchises, or other financial instruments, particularly in jurisdictions where such activity would be unlawful.
All content is of a general nature and may not address the specific circumstances of any individual or entity. It is not a substitute for professional advice or services. Any actions you take based on the information provided here are strictly at your own risk. You accept full responsibility for any decisions or outcomes arising from your use of this website and agree to release us from any liability in connection with your use of, or reliance upon, the content or products found herein.