
|
Hengli PetroChemical Co., Ltd. (600346.SS) Avaliação do DCF |
Totalmente Editável: Adapte-Se Às Suas Necessidades No Excel Ou Planilhas
Design Profissional: Modelos Confiáveis E Padrão Da Indústria
Pré-Construídos Para Uso Rápido E Eficiente
Compatível com MAC/PC, totalmente desbloqueado
Não É Necessária Experiência; Fácil De Seguir
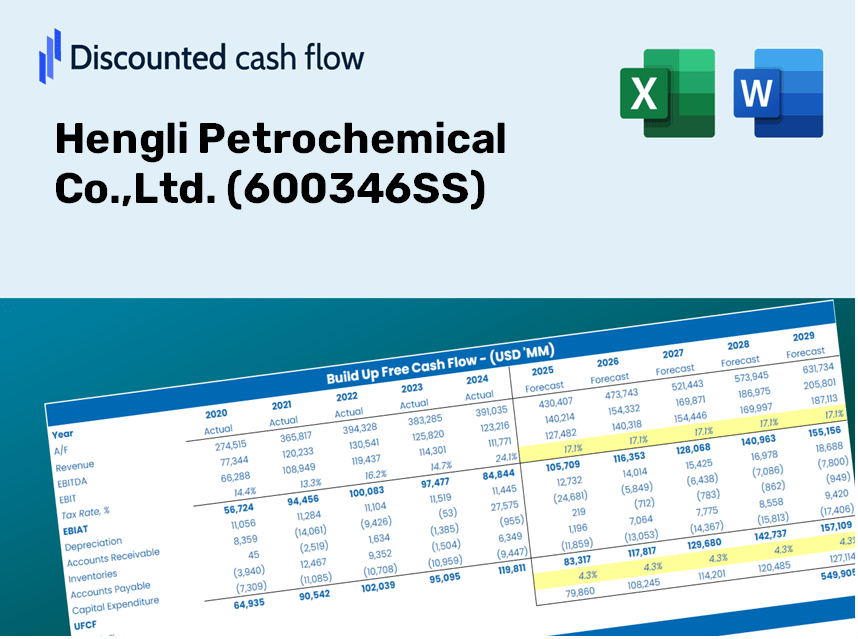
Hengli Petrochemical Co.,Ltd. (600346.SS) Bundle
Maximize a eficiência e melhore a precisão com a calculadora DCF (600346SS)! Com o acesso a Dados Real Hengli Petrochemical Co., Ltd. e suposições personalizáveis, essa ferramenta capacita você a prever, analisar e valorizar o hengli petroquímico como um investidor experiente.
Discounted Cash Flow (DCF) - (USD MM)
| Year | AY1 2020 |
AY2 2021 |
AY3 2022 |
AY4 2023 |
AY5 2024 |
FY1 2025 |
FY2 2026 |
FY3 2027 |
FY4 2028 |
FY5 2029 |
|---|---|---|---|---|---|---|---|---|---|---|
| Revenue | 152,373.4 | 197,984.8 | 222,345.9 | 234,830.9 | 236,360.1 | 265,021.6 | 297,158.6 | 333,192.7 | 373,596.3 | 418,899.3 |
| Revenue Growth, % | 0 | 29.93 | 12.3 | 5.62 | 0.65119 | 12.13 | 12.13 | 12.13 | 12.13 | 12.13 |
| EBITDA | 30,001.0 | 31,828.1 | 13,874.3 | 22,454.7 | 22,069.8 | 32,282.0 | 36,196.6 | 40,585.9 | 45,507.4 | 51,025.8 |
| EBITDA, % | 19.69 | 16.08 | 6.24 | 9.56 | 9.34 | 12.18 | 12.18 | 12.18 | 12.18 | 12.18 |
| Depreciation | 6,763.3 | 8,268.3 | 8,828.7 | 9,079.9 | 10,280.4 | 11,025.7 | 12,362.7 | 13,861.9 | 15,542.8 | 17,427.5 |
| Depreciation, % | 4.44 | 4.18 | 3.97 | 3.87 | 4.35 | 4.16 | 4.16 | 4.16 | 4.16 | 4.16 |
| EBIT | 23,237.7 | 23,559.8 | 5,045.6 | 13,374.8 | 11,789.4 | 21,256.3 | 23,833.9 | 26,724.0 | 29,964.7 | 33,598.2 |
| EBIT, % | 15.25 | 11.9 | 2.27 | 5.7 | 4.99 | 8.02 | 8.02 | 8.02 | 8.02 | 8.02 |
| Total Cash | 17,321.5 | 16,800.4 | 28,680.8 | 20,767.9 | 31,265.0 | 29,059.2 | 32,582.9 | 36,534.0 | 40,964.2 | 45,931.6 |
| Total Cash, percent | .0 | .0 | .0 | .0 | .0 | .0 | .0 | .0 | .0 | .0 |
| Account Receivables | 5,450.3 | 6,063.8 | 2,659.7 | .0 | 7,677.6 | 5,875.1 | 6,587.5 | 7,386.3 | 8,282.0 | 9,286.3 |
| Account Receivables, % | 3.58 | 3.06 | 1.2 | 0 | 3.25 | 2.22 | 2.22 | 2.22 | 2.22 | 2.22 |
| Inventories | 19,691.1 | 33,553.0 | 37,835.5 | 31,267.6 | 24,251.5 | 37,347.9 | 41,876.8 | 46,954.9 | 52,648.7 | 59,033.0 |
| Inventories, % | 12.92 | 16.95 | 17.02 | 13.31 | 10.26 | 14.09 | 14.09 | 14.09 | 14.09 | 14.09 |
| Accounts Payable | 22,809.8 | 26,739.5 | 29,473.1 | 13,612.8 | 20,937.0 | 29,887.0 | 33,511.1 | 37,574.8 | 42,131.2 | 47,240.1 |
| Accounts Payable, % | 14.97 | 13.51 | 13.26 | 5.8 | 8.86 | 11.28 | 11.28 | 11.28 | 11.28 | 11.28 |
| Capital Expenditure | -23,939.0 | -13,391.4 | -25,714.9 | -39,740.9 | -21,814.1 | -31,904.5 | -35,773.3 | -40,111.2 | -44,975.2 | -50,428.9 |
| Capital Expenditure, % | -15.71 | -6.76 | -11.57 | -16.92 | -9.23 | -12.04 | -12.04 | -12.04 | -12.04 | -12.04 |
| Tax Rate, % | 20.14 | 20.14 | 20.14 | 20.14 | 20.14 | 20.14 | 20.14 | 20.14 | 20.14 | 20.14 |
| EBITAT | 17,343.0 | 18,454.1 | 4,854.5 | 10,407.5 | 9,415.1 | 17,296.2 | 19,393.6 | 21,745.3 | 24,382.2 | 27,338.8 |
| Depreciation | ||||||||||
| Changes in Account Receivables | ||||||||||
| Changes in Inventories | ||||||||||
| Changes in Accounts Payable | ||||||||||
| Capital Expenditure | ||||||||||
| UFCF | -2,164.4 | 2,785.4 | -10,176.5 | -26,886.1 | 4,544.1 | -5,926.5 | -5,634.1 | -6,317.3 | -7,083.4 | -7,942.3 |
| WACC, % | 5.01 | 5.09 | 5.46 | 5.08 | 5.12 | 5.15 | 5.15 | 5.15 | 5.15 | 5.15 |
| PV UFCF | ||||||||||
| SUM PV UFCF | -28,138.7 | |||||||||
| Long Term Growth Rate, % | 2.00 | |||||||||
| Free cash flow (T + 1) | -8,101 | |||||||||
| Terminal Value | -257,167 | |||||||||
| Present Terminal Value | -200,062 | |||||||||
| Enterprise Value | -228,201 | |||||||||
| Net Debt | 120,799 | |||||||||
| Equity Value | -349,000 | |||||||||
| Diluted Shares Outstanding, MM | 7,044 | |||||||||
| Equity Value Per Share | -49.55 |
What You'll Receive
- Customizable Excel Template: A fully adaptable Excel-based DCF Calculator featuring pre-populated financial data for Hengli Petrochemical Co., Ltd. (600346SS).
- Actual Financial Data: Access historical performance figures and forward-looking projections (highlighted in the yellow cells).
- Adjustable Forecasts: Modify key assumptions such as revenue growth, EBITDA margin, and WACC as needed.
- Instant Calculations: Quickly observe how your inputs affect the valuation of Hengli Petrochemical Co., Ltd. (600346SS).
- Advanced Financial Tool: Designed for investors, CFOs, consultants, and financial analysts.
- Intuitive Interface: Organized for easy navigation, complete with clear step-by-step guidance.
Key Features
- Real-Life HENGLI Data: Pre-filled with Hengli Petrochemical’s historical financials and future projections.
- Fully Customizable Inputs: Modify revenue growth rates, profit margins, WACC, tax rates, and capital expenditures.
- Dynamic Valuation Model: Automatic updates to Net Present Value (NPV) and intrinsic value based on your parameters.
- Scenario Testing: Develop multiple forecasting scenarios to evaluate different valuation results.
- User-Friendly Interface: Intuitive, structured design suitable for both experienced professionals and newcomers.
How It Functions
- Download the Template: Gain immediate access to the Excel-based HENGLI Petrochemical DCF Calculator.
- Input Your Assumptions: Modify the yellow-highlighted cells for growth rates, WACC, margins, and other variables.
- Instant Calculations: The model automatically recalculates Hengli Petrochemical’s intrinsic value.
- Test Scenarios: Experiment with various assumptions to assess potential changes in valuation.
- Analyze and Decide: Utilize the results to inform your investment or financial analysis.
Why Opt for This Calculator?
- User-Friendly Design: Tailored for both novices and seasoned professionals.
- Customizable Parameters: Adjust inputs effortlessly to suit your analysis needs.
- Real-Time Adjustments: Witness immediate updates to Hengli Petrochemical’s valuation as you modify inputs.
- Preloaded Data: Comes with Hengli Petrochemical’s actual financial figures for swift assessments.
- Preferred by Experts: Adopted by investors and analysts for making well-informed choices.
Who Should Use This Product?
- Individual Investors: Make informed decisions about buying or selling Hengli Petrochemical Co., Ltd. (600346SS) stock.
- Financial Analysts: Enhance valuation workflows with user-friendly financial models tailored for Hengli Petrochemical Co., Ltd. (600346SS).
- Consultants: Provide accurate and timely valuation insights for clients regarding Hengli Petrochemical Co., Ltd. (600346SS).
- Business Owners: Gain insights into how large corporations like Hengli Petrochemical Co., Ltd. (600346SS) are valued to inform your own business strategies.
- Finance Students: Master valuation methodologies using real-world data and case studies focused on Hengli Petrochemical Co., Ltd. (600346SS).
Contents of the Template
- Pre-Filled Data: Contains Hengli Petrochemical's historical financial data and forecasts.
- Discounted Cash Flow Model: An editable DCF valuation model featuring automatic calculations.
- Weighted Average Cost of Capital (WACC): A specific sheet for WACC calculation using tailored inputs.
- Key Financial Ratios: Evaluate Hengli Petrochemical's profitability, efficiency, and leverage metrics.
- Customizable Inputs: Easily modify revenue growth rates, margins, and tax rates.
- Clear Dashboard: Visual presentations including charts and tables summarizing essential valuation results.
Disclaimer
All information, articles, and product details provided on this website are for general informational and educational purposes only. We do not claim any ownership over, nor do we intend to infringe upon, any trademarks, copyrights, logos, brand names, or other intellectual property mentioned or depicted on this site. Such intellectual property remains the property of its respective owners, and any references here are made solely for identification or informational purposes, without implying any affiliation, endorsement, or partnership.
We make no representations or warranties, express or implied, regarding the accuracy, completeness, or suitability of any content or products presented. Nothing on this website should be construed as legal, tax, investment, financial, medical, or other professional advice. In addition, no part of this site—including articles or product references—constitutes a solicitation, recommendation, endorsement, advertisement, or offer to buy or sell any securities, franchises, or other financial instruments, particularly in jurisdictions where such activity would be unlawful.
All content is of a general nature and may not address the specific circumstances of any individual or entity. It is not a substitute for professional advice or services. Any actions you take based on the information provided here are strictly at your own risk. You accept full responsibility for any decisions or outcomes arising from your use of this website and agree to release us from any liability in connection with your use of, or reliance upon, the content or products found herein.