
|
Joincare Pharmaceutical Group Industry Co., Ltd. (600380.SS) Avaliação do DCF |
Totalmente Editável: Adapte-Se Às Suas Necessidades No Excel Ou Planilhas
Design Profissional: Modelos Confiáveis E Padrão Da Indústria
Pré-Construídos Para Uso Rápido E Eficiente
Compatível com MAC/PC, totalmente desbloqueado
Não É Necessária Experiência; Fácil De Seguir
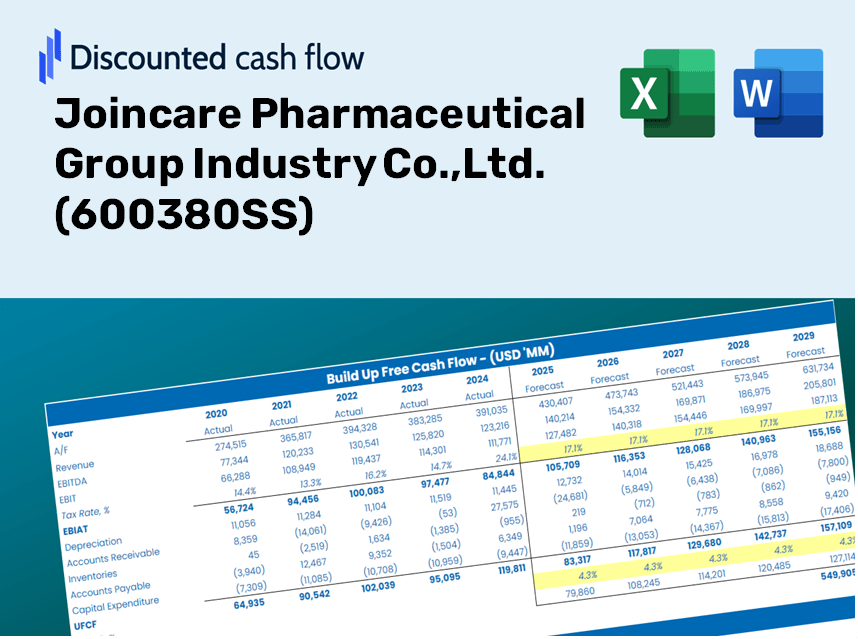
Joincare Pharmaceutical Group Industry Co.,Ltd. (600380.SS) Bundle
Projetado para precisão, nossa calculadora DCF (600380SS) permite avaliar a avaliação da Indústria do Grupo Pharmacêutico de Joincare, Ltd. Usando dados financeiros do mundo real, oferecendo completa flexibilidade para modificar todos os parâmetros essenciais para projeções aprimoradas.
Discounted Cash Flow (DCF) - (USD MM)
| Year | AY1 2020 |
AY2 2021 |
AY3 2022 |
AY4 2023 |
AY5 2024 |
FY1 2025 |
FY2 2026 |
FY3 2027 |
FY4 2028 |
FY5 2029 |
|---|---|---|---|---|---|---|---|---|---|---|
| Revenue | 13,521.6 | 15,903.7 | 17,142.8 | 16,646.4 | 15,619.5 | 16,433.5 | 17,289.9 | 18,190.9 | 19,138.9 | 20,136.2 |
| Revenue Growth, % | 0 | 17.62 | 7.79 | -2.9 | -6.17 | 5.21 | 5.21 | 5.21 | 5.21 | 5.21 |
| EBITDA | 2,988.6 | 3,166.9 | 3,682.6 | 3,837.3 | 3,865.6 | 3,658.0 | 3,848.6 | 4,049.2 | 4,260.2 | 4,482.2 |
| EBITDA, % | 22.1 | 19.91 | 21.48 | 23.05 | 24.75 | 22.26 | 22.26 | 22.26 | 22.26 | 22.26 |
| Depreciation | 546.9 | 594.5 | 805.3 | 1,022.2 | 775.7 | 775.2 | 815.6 | 858.1 | 902.9 | 949.9 |
| Depreciation, % | 4.04 | 3.74 | 4.7 | 6.14 | 4.97 | 4.72 | 4.72 | 4.72 | 4.72 | 4.72 |
| EBIT | 2,441.7 | 2,572.4 | 2,877.2 | 2,815.1 | 3,089.9 | 2,882.8 | 3,033.0 | 3,191.1 | 3,357.4 | 3,532.3 |
| EBIT, % | 18.06 | 16.18 | 16.78 | 16.91 | 19.78 | 17.54 | 17.54 | 17.54 | 17.54 | 17.54 |
| Total Cash | 12,317.4 | 11,913.9 | 14,917.5 | 16,181.2 | 14,941.3 | 14,655.0 | 15,418.8 | 16,222.3 | 17,067.7 | 17,957.1 |
| Total Cash, percent | .0 | .0 | .0 | .0 | .0 | .0 | .0 | .0 | .0 | .0 |
| Account Receivables | 4,036.6 | 4,831.3 | 5,116.3 | 4,634.1 | 4,432.3 | 4,808.2 | 5,058.7 | 5,322.3 | 5,599.7 | 5,891.5 |
| Account Receivables, % | 29.85 | 30.38 | 29.85 | 27.84 | 28.38 | 29.26 | 29.26 | 29.26 | 29.26 | 29.26 |
| Inventories | 1,831.5 | 2,078.9 | 2,561.9 | 2,655.8 | 2,621.3 | 2,442.0 | 2,569.2 | 2,703.1 | 2,844.0 | 2,992.2 |
| Inventories, % | 13.55 | 13.07 | 14.94 | 15.95 | 16.78 | 14.86 | 14.86 | 14.86 | 14.86 | 14.86 |
| Accounts Payable | 1,920.4 | 2,453.9 | 2,579.8 | 2,363.4 | 2,150.5 | 2,387.7 | 2,512.1 | 2,643.0 | 2,780.8 | 2,925.7 |
| Accounts Payable, % | 14.2 | 15.43 | 15.05 | 14.2 | 13.77 | 14.53 | 14.53 | 14.53 | 14.53 | 14.53 |
| Capital Expenditure | -830.4 | -1,521.4 | -1,147.8 | -1,130.1 | -979.1 | -1,165.5 | -1,226.2 | -1,290.1 | -1,357.4 | -1,428.1 |
| Capital Expenditure, % | -6.14 | -9.57 | -6.7 | -6.79 | -6.27 | -7.09 | -7.09 | -7.09 | -7.09 | -7.09 |
| Tax Rate, % | 61.21 | 61.21 | 61.21 | 61.21 | 61.21 | 61.21 | 61.21 | 61.21 | 61.21 | 61.21 |
| EBITAT | 927.3 | 1,157.6 | 1,251.1 | 1,172.0 | 1,198.5 | 1,192.8 | 1,254.9 | 1,320.3 | 1,389.1 | 1,461.5 |
| Depreciation | ||||||||||
| Changes in Account Receivables | ||||||||||
| Changes in Inventories | ||||||||||
| Changes in Accounts Payable | ||||||||||
| Capital Expenditure | ||||||||||
| UFCF | -3,303.9 | -278.0 | 266.5 | 1,235.8 | 1,018.4 | 843.2 | 590.9 | 621.7 | 654.1 | 688.2 |
| WACC, % | 4.21 | 4.25 | 4.24 | 4.23 | 4.21 | 4.23 | 4.23 | 4.23 | 4.23 | 4.23 |
| PV UFCF | ||||||||||
| SUM PV UFCF | 3,015.8 | |||||||||
| Long Term Growth Rate, % | 0.50 | |||||||||
| Free cash flow (T + 1) | 692 | |||||||||
| Terminal Value | 18,555 | |||||||||
| Present Terminal Value | 15,086 | |||||||||
| Enterprise Value | 18,101 | |||||||||
| Net Debt | -9,952 | |||||||||
| Equity Value | 28,054 | |||||||||
| Diluted Shares Outstanding, MM | 1,874 | |||||||||
| Equity Value Per Share | 14.97 |
What You Will Receive
- Adjustable Forecast Inputs: Seamlessly modify key assumptions (growth %, profit margins, WACC) to create various scenarios.
- Real-Time Data: Joincare Pharmaceutical Group's financial information pre-loaded to facilitate your analysis.
- Automated DCF Outputs: The template calculates Net Present Value (NPV) and intrinsic value automatically for you.
- Customizable and Professional: A refined Excel model tailored to fit your valuation requirements.
- Designed for Analysts and Investors: Perfect for testing projections, validating investment strategies, and optimizing your time.
Key Features
- Real-Time JKP Data: Pre-populated with Joincare’s historical financial performance and future projections.
- Comprehensive Input Customization: Modify revenue growth, profit margins, WACC, tax rates, and capital expenditures to suit your analysis.
- Adaptive Valuation Framework: Automatically recalculates Net Present Value (NPV) and intrinsic value based on adjusted inputs.
- Scenario Analysis: Develop multiple forecasting scenarios to evaluate various valuation outcomes.
- Intuitive Interface: Streamlined and organized design suitable for both experienced professionals and newcomers.
How It Works
- Download the Template: Gain immediate access to the Excel-based Joincare DCF Calculator for [600380SS].
- Input Your Assumptions: Modify the yellow-highlighted cells for growth rates, WACC, margins, and additional variables.
- Instant Calculations: The model will automatically calculate Joincare's intrinsic value.
- Test Scenarios: Experiment with different assumptions to assess potential changes in valuation.
- Analyze and Decide: Utilize the results to inform your investment or financial decisions.
Why Opt for Joincare's Calculator?
- Precision: Utilizes authentic Joincare financial data for unparalleled accuracy.
- Customizable: Built to allow users to freely explore and adjust inputs.
- Efficiency: Avoid the complexity of creating a DCF model from the ground up.
- High-Quality: Crafted with the expertise and attention typically found at the CFO level.
- Intuitive: User-friendly interface, ideal for those without extensive financial modeling skills.
Who Can Benefit from This Product?
- Investors: Assess Joincare Pharmaceutical Group’s valuation before making stock transactions.
- CFOs and Financial Analysts: Enhance valuation workflows and evaluate financial forecasts.
- Startup Founders: Understand the valuation methodologies applied to leading pharmaceutical companies like Joincare.
- Consultants: Provide comprehensive valuation reports for your clients.
- Students and Educators: Utilize real-world data from (600380SS) to practice and teach valuation strategies.
Contents of the Template
- Operating and Balance Sheet Data: Pre-filled historical data and forecasts for Joincare Pharmaceutical Group Industry Co., Ltd. (600380SS), covering revenue, EBITDA, EBIT, and capital expenditures.
- WACC Calculation: A dedicated section for calculating the Weighted Average Cost of Capital (WACC), including key parameters such as Beta, risk-free rate, and share price.
- DCF Valuation (Unlevered and Levered): Customizable Discounted Cash Flow models that provide intrinsic value analysis with comprehensive calculations.
- Financial Statements: Pre-loaded annual and quarterly financial statements to facilitate in-depth analysis.
- Key Ratios: Features a range of profitability, leverage, and efficiency ratios specific to Joincare Pharmaceutical Group Industry Co., Ltd. (600380SS).
- Dashboard and Charts: A visual overview of valuation outputs and assumptions to simplify results analysis.
Disclaimer
All information, articles, and product details provided on this website are for general informational and educational purposes only. We do not claim any ownership over, nor do we intend to infringe upon, any trademarks, copyrights, logos, brand names, or other intellectual property mentioned or depicted on this site. Such intellectual property remains the property of its respective owners, and any references here are made solely for identification or informational purposes, without implying any affiliation, endorsement, or partnership.
We make no representations or warranties, express or implied, regarding the accuracy, completeness, or suitability of any content or products presented. Nothing on this website should be construed as legal, tax, investment, financial, medical, or other professional advice. In addition, no part of this site—including articles or product references—constitutes a solicitation, recommendation, endorsement, advertisement, or offer to buy or sell any securities, franchises, or other financial instruments, particularly in jurisdictions where such activity would be unlawful.
All content is of a general nature and may not address the specific circumstances of any individual or entity. It is not a substitute for professional advice or services. Any actions you take based on the information provided here are strictly at your own risk. You accept full responsibility for any decisions or outcomes arising from your use of this website and agree to release us from any liability in connection with your use of, or reliance upon, the content or products found herein.