
|
Minmetals Capital Company Limited (600390.SS) Avaliação DCF |
Totalmente Editável: Adapte-Se Às Suas Necessidades No Excel Ou Planilhas
Design Profissional: Modelos Confiáveis E Padrão Da Indústria
Pré-Construídos Para Uso Rápido E Eficiente
Compatível com MAC/PC, totalmente desbloqueado
Não É Necessária Experiência; Fácil De Seguir
Minmetals Capital Company Limited (600390.SS) Bundle
Descubra o verdadeiro potencial da Minmetals Capital Company Limited (600390SS) com nossa calculadora DCF avançada! Ajuste as principais suposições, explore vários cenários e avalie como as mudanças afetam a avaliação do capital dos minmetals - tudo dentro de um modelo abrangente do Excel.
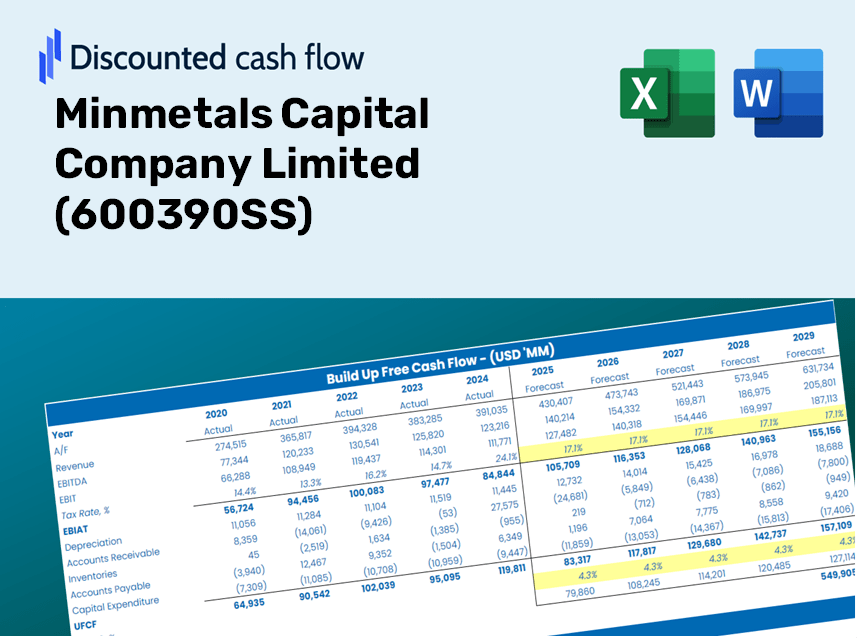
Discounted Cash Flow (DCF) - (USD MM)
| Year | AY1 2020 |
AY2 2021 |
AY3 2022 |
AY4 2023 |
AY5 2024 |
FY1 2025 |
FY2 2026 |
FY3 2027 |
FY4 2028 |
FY5 2029 |
|---|---|---|---|---|---|---|---|---|---|---|
| Revenue | 13,897.7 | 10,529.6 | 9,958.0 | 7,649.9 | 5,402.2 | 4,291.7 | 3,409.5 | 2,708.6 | 2,151.9 | 1,709.5 |
| Revenue Growth, % | 0 | -24.24 | -5.43 | -23.18 | -29.38 | -20.56 | -20.56 | -20.56 | -20.56 | -20.56 |
| EBITDA | 8,361.6 | 7,832.9 | 4,845.9 | 5,262.0 | 1,566.8 | 2,412.0 | 1,916.2 | 1,522.3 | 1,209.4 | 960.8 |
| EBITDA, % | 60.17 | 74.39 | 48.66 | 68.78 | 29 | 56.2 | 56.2 | 56.2 | 56.2 | 56.2 |
| Depreciation | 107.2 | 308.5 | 323.8 | 386.8 | 371.8 | 162.2 | 128.8 | 102.3 | 81.3 | 64.6 |
| Depreciation, % | 0.77101 | 2.93 | 3.25 | 5.06 | 6.88 | 3.78 | 3.78 | 3.78 | 3.78 | 3.78 |
| EBIT | 8,254.4 | 7,524.3 | 4,522.2 | 4,875.2 | 1,194.9 | 2,249.8 | 1,787.4 | 1,419.9 | 1,128.1 | 896.2 |
| EBIT, % | 59.39 | 71.46 | 45.41 | 63.73 | 22.12 | 52.42 | 52.42 | 52.42 | 52.42 | 52.42 |
| Total Cash | 43,800.4 | 46,775.5 | 55,140.6 | 61,146.0 | 60,709.4 | 4,291.7 | 3,409.5 | 2,708.6 | 2,151.9 | 1,709.5 |
| Total Cash, percent | .0 | .0 | .0 | .0 | .0 | .0 | .0 | .0 | .0 | .0 |
| Account Receivables | 3,806.3 | 6,068.3 | 7,153.1 | 6,098.5 | 3,721.8 | 2,621.9 | 2,083.0 | 1,654.8 | 1,314.6 | 1,044.4 |
| Account Receivables, % | 27.39 | 57.63 | 71.83 | 79.72 | 68.89 | 61.09 | 61.09 | 61.09 | 61.09 | 61.09 |
| Inventories | 236.5 | 185.4 | 65.9 | 111.8 | 296.5 | 95.0 | 75.5 | 60.0 | 47.7 | 37.9 |
| Inventories, % | 1.7 | 1.76 | 0.66129 | 1.46 | 5.49 | 2.21 | 2.21 | 2.21 | 2.21 | 2.21 |
| Accounts Payable | 81.1 | 815.5 | 311.7 | 310.1 | 289.5 | 179.1 | 142.3 | 113.1 | 89.8 | 71.4 |
| Accounts Payable, % | 0.58326 | 7.74 | 3.13 | 4.05 | 5.36 | 4.17 | 4.17 | 4.17 | 4.17 | 4.17 |
| Capital Expenditure | -260.5 | -207.8 | -205.2 | -267.2 | -269.6 | -123.5 | -98.1 | -78.0 | -61.9 | -49.2 |
| Capital Expenditure, % | -1.87 | -1.97 | -2.06 | -3.49 | -4.99 | -2.88 | -2.88 | -2.88 | -2.88 | -2.88 |
| Tax Rate, % | 40.17 | 40.17 | 40.17 | 40.17 | 40.17 | 40.17 | 40.17 | 40.17 | 40.17 | 40.17 |
| EBITAT | 5,281.6 | 4,673.5 | 2,741.6 | 3,075.6 | 715.0 | 1,393.3 | 1,106.9 | 879.4 | 698.6 | 555.0 |
| Depreciation | ||||||||||
| Changes in Account Receivables | ||||||||||
| Changes in Inventories | ||||||||||
| Changes in Accounts Payable | ||||||||||
| Capital Expenditure | ||||||||||
| UFCF | 1,166.5 | 3,297.8 | 1,391.1 | 4,202.3 | 2,988.5 | 2,622.9 | 1,659.2 | 1,318.2 | 1,047.2 | 831.9 |
| WACC, % | 4.06 | 4.02 | 3.98 | 4.04 | 3.97 | 4.01 | 4.01 | 4.01 | 4.01 | 4.01 |
| PV UFCF | ||||||||||
| SUM PV UFCF | 6,804.6 | |||||||||
| Long Term Growth Rate, % | 2.00 | |||||||||
| Free cash flow (T + 1) | 849 | |||||||||
| Terminal Value | 42,125 | |||||||||
| Present Terminal Value | 34,600 | |||||||||
| Enterprise Value | 41,405 | |||||||||
| Net Debt | 30,746 | |||||||||
| Equity Value | 10,659 | |||||||||
| Diluted Shares Outstanding, MM | 5,055 | |||||||||
| Equity Value Per Share | 2.11 |
What You Will Receive
- Genuine 600390SS Financials: Access to both historical and projected data for precise valuation.
- Customizable Parameters: Adjust WACC, tax rates, revenue growth, and capital expenditures as needed.
- Real-Time Calculations: Intrinsic value and NPV are computed automatically.
- Scenario Planning: Explore various scenarios to assess Minmetals Capital Company Limited's future performance.
- User-Friendly Interface: Designed for industry professionals while remaining approachable for newcomers.
Key Features
- Comprehensive Historical Data for Minmetals Capital: Pre-loaded with the company’s past financial performance and future projections.
- Customizable Financial Inputs: Tailor revenue growth rates, profit margins, WACC, tax rates, and capital expenditures according to your analysis.
- Interactive Valuation Model: Real-time updates to Net Present Value (NPV) and intrinsic value that reflect your input modifications.
- Scenario Analysis: Develop multiple forecasting scenarios to evaluate various potential valuation results.
- Intuitive User Interface: Designed for ease of use, catering to both industry experts and newcomers.
How It Works
- Step 1: Download the Excel file for Minmetals Capital Company Limited (600390SS).
- Step 2: Review the pre-filled financial data and projections for Minmetals Capital.
- Step 3: Adjust key inputs such as revenue growth, WACC, and tax rates (highlighted cells).
- Step 4: Observe the DCF model update in real-time as you modify your assumptions.
- Step 5: Analyze the results and utilize the findings for your investment strategies.
Why Choose This Calculator for Minmetals Capital Company Limited (600390SS)?
- Accuracy: Utilizes real financial data from Minmetals Capital for reliable results.
- Flexibility: Built for users to easily adjust and experiment with input variables.
- Time-Saving: Avoid the complexities of constructing a DCF model from the ground up.
- Professional-Grade: Crafted with the precision and usability required by CFOs.
- User-Friendly: Intuitive interface suitable for users with varying levels of financial modeling expertise.
Who Can Benefit from This Product?
- Investors: Assess Minmetals Capital's valuation prior to making investment decisions.
- CFOs and Financial Analysts: Optimize valuation methodologies and evaluate forecasts.
- Startup Founders: Understand the valuation methods applied to prominent companies like Minmetals Capital (600390SS).
- Consultants: Create comprehensive valuation reports for your clients.
- Students and Educators: Utilize real-time data to learn and teach valuation strategies.
Contents of the Template
- Preloaded 600390SS Data: Historical and projected financial metrics, such as revenue, EBIT, and capital expenditures.
- DCF and WACC Models: Advanced spreadsheets for determining intrinsic value and Weighted Average Cost of Capital.
- Editable Inputs: Cells highlighted in yellow for modifying revenue growth rates, tax rates, and discount rates.
- Financial Statements: Detailed annual and quarterly financial reports for in-depth analysis.
- Key Ratios: Metrics for profitability, leverage, and efficiency to assess performance.
- Dashboard and Charts: Visual representations of valuation results and underlying assumptions.
Disclaimer
All information, articles, and product details provided on this website are for general informational and educational purposes only. We do not claim any ownership over, nor do we intend to infringe upon, any trademarks, copyrights, logos, brand names, or other intellectual property mentioned or depicted on this site. Such intellectual property remains the property of its respective owners, and any references here are made solely for identification or informational purposes, without implying any affiliation, endorsement, or partnership.
We make no representations or warranties, express or implied, regarding the accuracy, completeness, or suitability of any content or products presented. Nothing on this website should be construed as legal, tax, investment, financial, medical, or other professional advice. In addition, no part of this site—including articles or product references—constitutes a solicitation, recommendation, endorsement, advertisement, or offer to buy or sell any securities, franchises, or other financial instruments, particularly in jurisdictions where such activity would be unlawful.
All content is of a general nature and may not address the specific circumstances of any individual or entity. It is not a substitute for professional advice or services. Any actions you take based on the information provided here are strictly at your own risk. You accept full responsibility for any decisions or outcomes arising from your use of this website and agree to release us from any liability in connection with your use of, or reliance upon, the content or products found herein.