
|
Nari Technology Co., Ltd. (600406.SS) Avaliação DCF |
Totalmente Editável: Adapte-Se Às Suas Necessidades No Excel Ou Planilhas
Design Profissional: Modelos Confiáveis E Padrão Da Indústria
Pré-Construídos Para Uso Rápido E Eficiente
Compatível com MAC/PC, totalmente desbloqueado
Não É Necessária Experiência; Fácil De Seguir
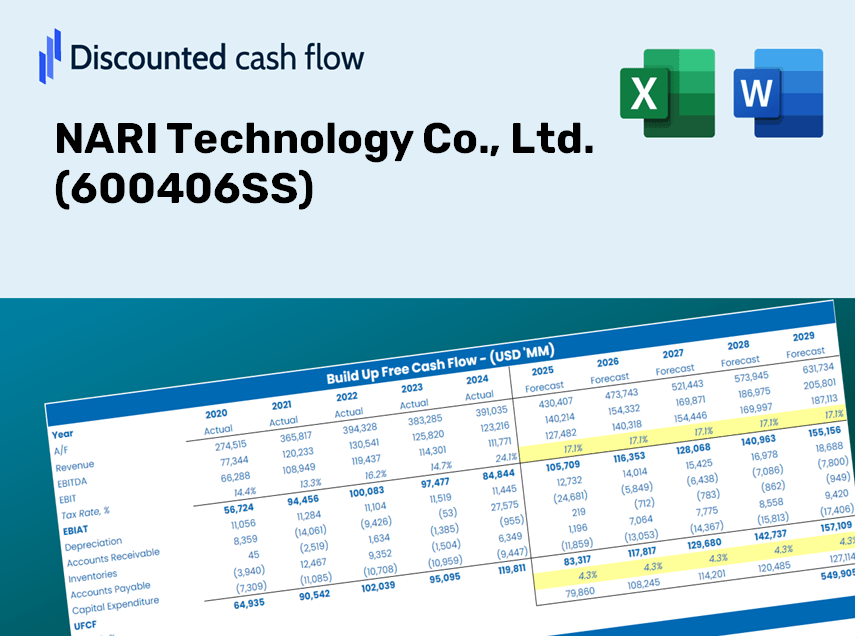
NARI Technology Co., Ltd. (600406.SS) Bundle
Avalie as perspectivas financeiras da Nari Technology Co., Ltd. Como um especialista! Esta calculadora DCF (600406SS) fornece dados financeiros pré-preenchidos e flexibilidade total para modificar o crescimento da receita, WACC, margens e outras suposições críticas para se alinhar às suas projeções.
Discounted Cash Flow (DCF) - (USD MM)
| Year | AY1 2020 |
AY2 2021 |
AY3 2022 |
AY4 2023 |
AY5 2024 |
FY1 2025 |
FY2 2026 |
FY3 2027 |
FY4 2028 |
FY5 2029 |
|---|---|---|---|---|---|---|---|---|---|---|
| Revenue | 38,502.4 | 42,411.0 | 46,829.0 | 51,655.2 | 57,417.3 | 63,450.3 | 70,117.3 | 77,484.7 | 85,626.4 | 94,623.4 |
| Revenue Growth, % | 0 | 10.15 | 10.42 | 10.31 | 11.15 | 10.51 | 10.51 | 10.51 | 10.51 | 10.51 |
| EBITDA | 6,862.4 | 7,877.5 | 8,599.8 | 9,572.9 | 9,914.5 | 11,492.3 | 12,699.8 | 14,034.3 | 15,508.9 | 17,138.5 |
| EBITDA, % | 17.82 | 18.57 | 18.36 | 18.53 | 17.27 | 18.11 | 18.11 | 18.11 | 18.11 | 18.11 |
| Depreciation | 1,124.0 | 1,274.3 | 1,360.1 | 1,644.7 | 1,553.3 | 1,867.7 | 2,064.0 | 2,280.8 | 2,520.5 | 2,785.3 |
| Depreciation, % | 2.92 | 3 | 2.9 | 3.18 | 2.71 | 2.94 | 2.94 | 2.94 | 2.94 | 2.94 |
| EBIT | 5,738.3 | 6,603.3 | 7,239.6 | 7,928.2 | 8,361.2 | 9,624.6 | 10,635.9 | 11,753.4 | 12,988.4 | 14,353.2 |
| EBIT, % | 14.9 | 15.57 | 15.46 | 15.35 | 14.56 | 15.17 | 15.17 | 15.17 | 15.17 | 15.17 |
| Total Cash | 13,641.6 | 13,848.2 | 16,490.9 | 22,350.4 | 24,756.2 | 24,070.9 | 26,600.1 | 29,395.0 | 32,483.7 | 35,896.9 |
| Total Cash, percent | .0 | .0 | .0 | .0 | .0 | .0 | .0 | .0 | .0 | .0 |
| Account Receivables | 22,637.0 | 26,048.7 | 28,146.5 | 31,180.8 | 35,155.5 | 38,312.5 | 42,338.1 | 46,786.8 | 51,702.8 | 57,135.4 |
| Account Receivables, % | 58.79 | 61.42 | 60.1 | 60.36 | 61.23 | 60.38 | 60.38 | 60.38 | 60.38 | 60.38 |
| Inventories | 7,819.7 | 7,867.8 | 8,293.9 | 9,794.7 | 11,311.6 | 12,085.3 | 13,355.1 | 14,758.4 | 16,309.1 | 18,022.8 |
| Inventories, % | 20.31 | 18.55 | 17.71 | 18.96 | 19.7 | 19.05 | 19.05 | 19.05 | 19.05 | 19.05 |
| Accounts Payable | 21,275.4 | 23,002.5 | 22,891.4 | 26,661.1 | 28,860.4 | 33,026.5 | 36,496.8 | 40,331.6 | 44,569.4 | 49,252.5 |
| Accounts Payable, % | 55.26 | 54.24 | 48.88 | 51.61 | 50.26 | 52.05 | 52.05 | 52.05 | 52.05 | 52.05 |
| Capital Expenditure | -3,464.0 | -2,016.4 | -3,415.2 | -1,952.2 | -1,831.8 | -3,555.0 | -3,928.5 | -4,341.3 | -4,797.4 | -5,301.5 |
| Capital Expenditure, % | -9 | -4.75 | -7.29 | -3.78 | -3.19 | -5.6 | -5.6 | -5.6 | -5.6 | -5.6 |
| Tax Rate, % | 16.63 | 16.63 | 16.63 | 16.63 | 16.63 | 16.63 | 16.63 | 16.63 | 16.63 | 16.63 |
| EBITAT | 4,691.2 | 5,426.3 | 5,918.5 | 6,646.2 | 6,970.7 | 7,947.6 | 8,782.7 | 9,705.5 | 10,725.3 | 11,852.2 |
| Depreciation | ||||||||||
| Changes in Account Receivables | ||||||||||
| Changes in Inventories | ||||||||||
| Changes in Accounts Payable | ||||||||||
| Capital Expenditure | ||||||||||
| UFCF | -6,830.0 | 2,951.4 | 1,228.4 | 5,573.4 | 3,400.0 | 6,495.7 | 5,092.9 | 5,628.0 | 6,219.3 | 6,872.8 |
| WACC, % | 6.26 | 6.26 | 6.26 | 6.26 | 6.26 | 6.26 | 6.26 | 6.26 | 6.26 | 6.26 |
| PV UFCF | ||||||||||
| SUM PV UFCF | 25,266.7 | |||||||||
| Long Term Growth Rate, % | 3.00 | |||||||||
| Free cash flow (T + 1) | 7,079 | |||||||||
| Terminal Value | 217,229 | |||||||||
| Present Terminal Value | 160,359 | |||||||||
| Enterprise Value | 185,626 | |||||||||
| Net Debt | -8,491 | |||||||||
| Equity Value | 194,117 | |||||||||
| Diluted Shares Outstanding, MM | 7,962 | |||||||||
| Equity Value Per Share | 24.38 |
Benefits You Will Receive
- Accurate NARI Financials: Access both historical and projected data for precise valuation.
- Customizable Inputs: Adjust WACC, tax rates, revenue growth, and capital expenditures to fit your analysis.
- Real-Time Calculations: Dynamic calculation of intrinsic value and NPV for informed decision-making.
- Scenario Testing: Explore various scenarios to assess the future outlook for NARI Technology Co., Ltd. (600406SS).
- User-Friendly Interface: Designed for industry professionals while remaining approachable for newcomers.
Key Features
- Comprehensive DCF Calculator: Offers detailed unlevered and levered DCF valuation models tailored for NARI Technology Co., Ltd. (600406SS).
- WACC Calculator: Features a pre-structured Weighted Average Cost of Capital sheet with adjustable inputs specific to the company's needs.
- Customizable Forecast Assumptions: Easily alter growth projections, capital expenditures, and discount rates to reflect NARI's strategic outlook.
- Integrated Financial Ratios: Evaluate key profitability, leverage, and efficiency ratios pertinent to NARI Technology Co., Ltd. (600406SS).
- Interactive Dashboard and Charts: Visual representations encapsulate essential valuation metrics for streamlined analysis.
How It Operates
- Download the Template: Gain immediate access to the Excel-based NARI Technology DCF Calculator.
- Input Your Assumptions: Modify the yellow-highlighted fields for growth rates, WACC, margins, and additional parameters.
- Instant Calculations: The model promptly recalculates NARI Technology’s intrinsic value.
- Test Scenarios: Experiment with various assumptions to assess potential valuation fluctuations.
- Analyze and Decide: Utilize the outcomes to inform your investment or financial decisions.
Why Choose NARI Technology Co., Ltd. (600406SS) Calculator?
- Reliable Data: Access to accurate NARI financials guarantees dependable valuation outcomes.
- Flexible Options: Tailor essential inputs such as growth rates, WACC, and tax rates to fit your forecasts.
- Efficient: Built-in calculations save you the effort of creating formulas from the ground up.
- Professional-Quality Tool: Crafted specifically for investors, analysts, and consultants.
- Easy to Use: User-friendly design and clear, step-by-step guidance ensure ease for all users.
Who Can Benefit From NARI Technology Co., Ltd. (600406SS)?
- Individual Investors: Gain insights for making informed decisions regarding NARI Technology Co., Ltd. (600406SS) stock transactions.
- Financial Analysts: Enhance valuation methodologies with comprehensive, pre-built financial models for NARI Technology Co., Ltd. (600406SS).
- Consultants: Provide clients with swift and precise valuation analyses of NARI Technology Co., Ltd. (600406SS).
- Business Owners: Learn how major firms like NARI Technology Co., Ltd. (600406SS) are valued to inform your own business strategies.
- Finance Students: Master valuation principles using current data and real-world examples, including NARI Technology Co., Ltd. (600406SS).
Contents of the Template
- Operating and Balance Sheet Data: Pre-filled historical data and forecasts for NARI Technology Co., Ltd. (600406SS), including revenue, EBITDA, EBIT, and capital expenditures.
- WACC Calculation: A dedicated worksheet for calculating the Weighted Average Cost of Capital (WACC), featuring parameters such as Beta, risk-free rate, and share price.
- DCF Valuation (Unlevered and Levered): Customizable Discounted Cash Flow models that display intrinsic value along with comprehensive calculations.
- Financial Statements: Pre-loaded annual and quarterly financial statements to facilitate thorough analysis.
- Key Ratios: Includes profitability, leverage, and efficiency ratios specific to NARI Technology Co., Ltd. (600406SS).
- Dashboard and Charts: Visual representations of valuation outputs and assumptions for easy analysis of results.
Disclaimer
All information, articles, and product details provided on this website are for general informational and educational purposes only. We do not claim any ownership over, nor do we intend to infringe upon, any trademarks, copyrights, logos, brand names, or other intellectual property mentioned or depicted on this site. Such intellectual property remains the property of its respective owners, and any references here are made solely for identification or informational purposes, without implying any affiliation, endorsement, or partnership.
We make no representations or warranties, express or implied, regarding the accuracy, completeness, or suitability of any content or products presented. Nothing on this website should be construed as legal, tax, investment, financial, medical, or other professional advice. In addition, no part of this site—including articles or product references—constitutes a solicitation, recommendation, endorsement, advertisement, or offer to buy or sell any securities, franchises, or other financial instruments, particularly in jurisdictions where such activity would be unlawful.
All content is of a general nature and may not address the specific circumstances of any individual or entity. It is not a substitute for professional advice or services. Any actions you take based on the information provided here are strictly at your own risk. You accept full responsibility for any decisions or outcomes arising from your use of this website and agree to release us from any liability in connection with your use of, or reliance upon, the content or products found herein.