
|
Tangshan Sanyou Chemical Industries Co., Ltd (600409.SS) Avaliação DCF |
Totalmente Editável: Adapte-Se Às Suas Necessidades No Excel Ou Planilhas
Design Profissional: Modelos Confiáveis E Padrão Da Indústria
Pré-Construídos Para Uso Rápido E Eficiente
Compatível com MAC/PC, totalmente desbloqueado
Não É Necessária Experiência; Fácil De Seguir
Tangshan Sanyou Chemical Industries Co.,Ltd (600409.SS) Bundle
Simplifique sua análise e aumente a precisão com a calculadora DCF (600409SS)! Utilizando dados reais da Tangshan Sanyou Chemical Industries Co., LTD e suposições personalizáveis, essa ferramenta o capacita a prever, analisar e valorizar Tangshan Sanyou como um investidor experiente.
Discounted Cash Flow (DCF) - (USD MM)
| Year | AY1 2020 |
AY2 2021 |
AY3 2022 |
AY4 2023 |
AY5 2024 |
FY1 2025 |
FY2 2026 |
FY3 2027 |
FY4 2028 |
FY5 2029 |
|---|---|---|---|---|---|---|---|---|---|---|
| Revenue | 17,780.3 | 23,182.2 | 23,679.8 | 21,920.1 | 21,361.2 | 22,565.3 | 23,837.2 | 25,180.9 | 26,600.3 | 28,099.7 |
| Revenue Growth, % | 0 | 30.38 | 2.15 | -7.43 | -2.55 | 5.64 | 5.64 | 5.64 | 5.64 | 5.64 |
| EBITDA | 2,369.3 | 3,817.9 | 3,164.9 | 2,881.2 | 2,212.8 | 3,008.5 | 3,178.1 | 3,357.2 | 3,546.5 | 3,746.4 |
| EBITDA, % | 13.33 | 16.47 | 13.37 | 13.14 | 10.36 | 13.33 | 13.33 | 13.33 | 13.33 | 13.33 |
| Depreciation | 1,139.5 | 1,233.4 | 1,212.8 | 1,220.1 | 1,237.4 | 1,273.1 | 1,344.9 | 1,420.7 | 1,500.8 | 1,585.4 |
| Depreciation, % | 6.41 | 5.32 | 5.12 | 5.57 | 5.79 | 5.64 | 5.64 | 5.64 | 5.64 | 5.64 |
| EBIT | 1,229.8 | 2,584.4 | 1,952.2 | 1,661.1 | 975.4 | 1,735.4 | 1,833.2 | 1,936.6 | 2,045.7 | 2,161.0 |
| EBIT, % | 6.92 | 11.15 | 8.24 | 7.58 | 4.57 | 7.69 | 7.69 | 7.69 | 7.69 | 7.69 |
| Total Cash | 2,802.5 | 3,038.7 | 4,840.0 | 3,287.4 | 3,473.9 | 3,636.1 | 3,841.1 | 4,057.6 | 4,286.3 | 4,527.9 |
| Total Cash, percent | .0 | .0 | .0 | .0 | .0 | .0 | .0 | .0 | .0 | .0 |
| Account Receivables | 2,827.5 | 3,460.6 | 3,566.2 | 2,873.6 | 1,797.1 | 3,042.4 | 3,213.9 | 3,395.0 | 3,586.4 | 3,788.5 |
| Account Receivables, % | 15.9 | 14.93 | 15.06 | 13.11 | 8.41 | 13.48 | 13.48 | 13.48 | 13.48 | 13.48 |
| Inventories | 1,391.7 | 2,132.0 | 1,659.0 | 1,444.9 | 1,625.2 | 1,725.3 | 1,822.6 | 1,925.3 | 2,033.8 | 2,148.5 |
| Inventories, % | 7.83 | 9.2 | 7.01 | 6.59 | 7.61 | 7.65 | 7.65 | 7.65 | 7.65 | 7.65 |
| Accounts Payable | 2,956.4 | 2,848.4 | 3,065.2 | 3,132.8 | 3,281.9 | 3,227.5 | 3,409.4 | 3,601.6 | 3,804.6 | 4,019.1 |
| Accounts Payable, % | 16.63 | 12.29 | 12.94 | 14.29 | 15.36 | 14.3 | 14.3 | 14.3 | 14.3 | 14.3 |
| Capital Expenditure | -130.0 | -66.6 | -375.6 | -337.4 | -1,090.3 | -417.4 | -440.9 | -465.8 | -492.0 | -519.7 |
| Capital Expenditure, % | -0.73121 | -0.28742 | -1.59 | -1.54 | -5.1 | -1.85 | -1.85 | -1.85 | -1.85 | -1.85 |
| Tax Rate, % | 39.93 | 39.93 | 39.93 | 39.93 | 39.93 | 39.93 | 39.93 | 39.93 | 39.93 | 39.93 |
| EBITAT | 995.9 | 1,872.8 | 1,530.4 | 664.2 | 585.9 | 1,152.0 | 1,216.9 | 1,285.5 | 1,358.0 | 1,434.5 |
| Depreciation | ||||||||||
| Changes in Account Receivables | ||||||||||
| Changes in Inventories | ||||||||||
| Changes in Accounts Payable | ||||||||||
| Capital Expenditure | ||||||||||
| UFCF | 742.5 | 1,558.2 | 2,951.8 | 2,521.2 | 1,778.4 | 607.9 | 2,034.1 | 2,148.7 | 2,269.8 | 2,397.8 |
| WACC, % | 6.51 | 6.41 | 6.48 | 6.01 | 6.26 | 6.33 | 6.33 | 6.33 | 6.33 | 6.33 |
| PV UFCF | ||||||||||
| SUM PV UFCF | 7,697.2 | |||||||||
| Long Term Growth Rate, % | 0.50 | |||||||||
| Free cash flow (T + 1) | 2,410 | |||||||||
| Terminal Value | 41,312 | |||||||||
| Present Terminal Value | 30,390 | |||||||||
| Enterprise Value | 38,087 | |||||||||
| Net Debt | 389 | |||||||||
| Equity Value | 37,698 | |||||||||
| Diluted Shares Outstanding, MM | 2,065 | |||||||||
| Equity Value Per Share | 18.26 |
Benefits You Will Receive
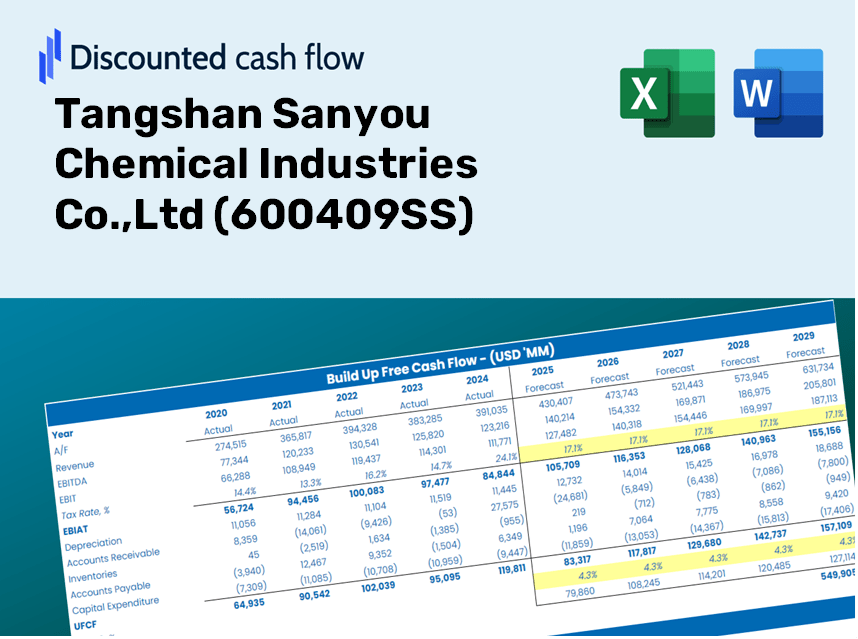
- Customizable Excel Template: A fully adjustable Excel-based DCF Calculator featuring pre-loaded financial data for Tangshan Sanyou Chemical Industries Co.,Ltd (600409SS).
- Authentic Data: Access to historical performance metrics and future projections (highlighted in the yellow cells).
- Adaptive Forecasting: Modify assumptions related to revenue growth, EBITDA %, and WACC as needed.
- Instant Calculations: Quickly assess how your inputs influence the valuation of Tangshan Sanyou Chemical Industries Co.,Ltd (600409SS).
- Professional-Grade Tool: Designed for investors, CFOs, consultants, and financial analysts.
- User-Centric Interface: Organized for simplicity and user-friendliness, accompanied by detailed instructions.
Key Features
- Authentic Financial Data: Gain access to reliable pre-loaded historical information and future forecasts for Tangshan Sanyou Chemical Industries Co., Ltd (600409SS).
- Tailorable Forecast Inputs: Modify highlighted cells to adjust assumptions such as WACC, growth rates, and profit margins.
- Real-Time Calculations: Automatically refresh DCF, Net Present Value (NPV), and cash flow assessments.
- Interactive Dashboard: User-friendly visualizations and summaries to present your valuation insights clearly.
- Designed for All Skill Levels: An easy-to-navigate framework suitable for investors, CFOs, and consultants alike.
How It Works
- Step 1: Download the prebuilt Excel template that includes Tangshan Sanyou Chemical Industries Co., Ltd’s data.
- Step 2: Review the pre-filled sheets to familiarize yourself with the essential metrics.
- Step 3: Modify forecasts and assumptions in the editable yellow cells (WACC, growth, margins).
- Step 4: Instantly see the updated results, including Tangshan Sanyou Chemical Industries Co., Ltd’s intrinsic value.
- Step 5: Make well-informed investment decisions or create reports based on the provided outputs.
Why Opt for Tangshan Sanyou Chemical's Calculator?
- Save Time: Instantly access a DCF model – no need to build from the ground up.
- Enhance Accuracy: Utilize dependable financial data and formulas to minimize valuation errors.
- Completely Customizable: Adjust the model to match your own assumptions and forecasts.
- Simple to Understand: Intuitive charts and outputs facilitate easy analysis of results.
- Endorsed by Professionals: Crafted for experts prioritizing both precision and ease of use.
Who Can Benefit from This Product?
- Investors: Evaluate Tangshan Sanyou Chemical Industries Co., Ltd’s ([600409SS]) valuation before making investment decisions.
- CFOs and Financial Analysts: Optimize valuation methods and analyze forecasts for improved accuracy.
- Startup Founders: Understand the valuation practices of established companies like Tangshan Sanyou ([600409SS]).
- Consultants: Create comprehensive valuation reports for your clients using insights from Tangshan Sanyou ([600409SS]).
- Students and Educators: Apply real-world data from Tangshan Sanyou ([600409SS]) to enhance learning and teaching of valuation techniques.
Contents of the Template
- Operating and Balance Sheet Data: Pre-loaded historical data and forecasts for Tangshan Sanyou Chemical Industries Co., Ltd (600409SS), including revenue, EBITDA, EBIT, and capital expenditures.
- WACC Calculation: A specific sheet for calculating the Weighted Average Cost of Capital (WACC), featuring key parameters such as Beta, risk-free rate, and share price.
- DCF Valuation (Unlevered and Levered): Customizable Discounted Cash Flow models that provide intrinsic value estimates with comprehensive calculations.
- Financial Statements: Pre-filled financial statements (both annual and quarterly) to facilitate detailed analysis.
- Key Ratios: Incorporates profitability, leverage, and efficiency ratios specific to Tangshan Sanyou Chemical Industries Co., Ltd (600409SS).
- Dashboard and Charts: Visual representation of valuation results and underlying assumptions for straightforward analysis.
Disclaimer
All information, articles, and product details provided on this website are for general informational and educational purposes only. We do not claim any ownership over, nor do we intend to infringe upon, any trademarks, copyrights, logos, brand names, or other intellectual property mentioned or depicted on this site. Such intellectual property remains the property of its respective owners, and any references here are made solely for identification or informational purposes, without implying any affiliation, endorsement, or partnership.
We make no representations or warranties, express or implied, regarding the accuracy, completeness, or suitability of any content or products presented. Nothing on this website should be construed as legal, tax, investment, financial, medical, or other professional advice. In addition, no part of this site—including articles or product references—constitutes a solicitation, recommendation, endorsement, advertisement, or offer to buy or sell any securities, franchises, or other financial instruments, particularly in jurisdictions where such activity would be unlawful.
All content is of a general nature and may not address the specific circumstances of any individual or entity. It is not a substitute for professional advice or services. Any actions you take based on the information provided here are strictly at your own risk. You accept full responsibility for any decisions or outcomes arising from your use of this website and agree to release us from any liability in connection with your use of, or reliance upon, the content or products found herein.