
|
Xiangtan Electric Manufacturing Co. Ltd. (600416.SS) Avaliação DCF |
Totalmente Editável: Adapte-Se Às Suas Necessidades No Excel Ou Planilhas
Design Profissional: Modelos Confiáveis E Padrão Da Indústria
Pré-Construídos Para Uso Rápido E Eficiente
Compatível com MAC/PC, totalmente desbloqueado
Não É Necessária Experiência; Fácil De Seguir
Xiangtan Electric Manufacturing Co. Ltd. (600416.SS) Bundle
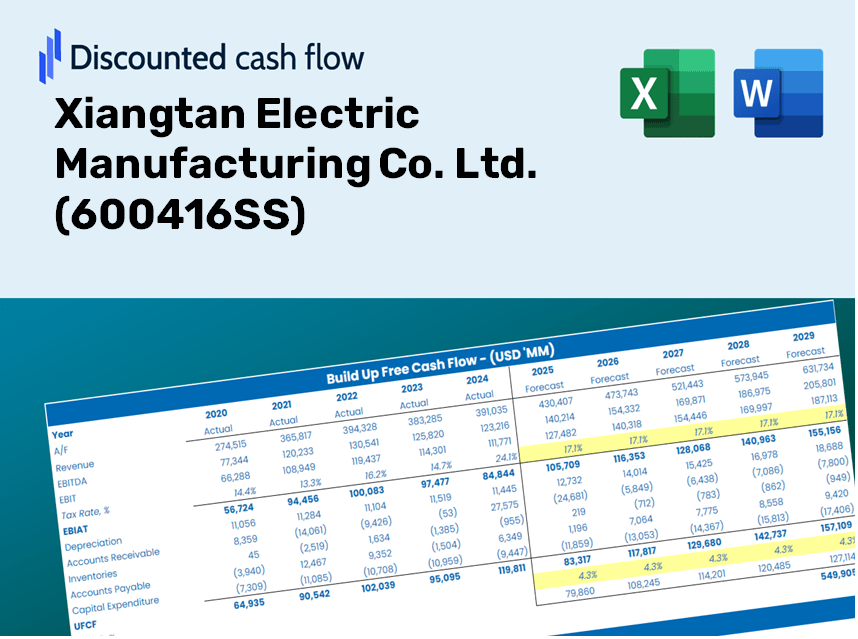
Simplifique a avaliação Xiangtan Electric Manufacturing Co. Ltd. com esta calculadora DCF personalizável! Apresentando a Xiangtan Electric Manufacturing Co. Ltd. Finanças e entradas de previsão ajustáveis, você pode testar cenários e descobrir o valor justo da Xiangtan Electric Manufacturing Co. Ltd. em minutos.
Discounted Cash Flow (DCF) - (USD MM)
| Year | AY1 2020 |
AY2 2021 |
AY3 2022 |
AY4 2023 |
AY5 2024 |
FY1 2025 |
FY2 2026 |
FY3 2027 |
FY4 2028 |
FY5 2029 |
|---|---|---|---|---|---|---|---|---|---|---|
| Revenue | 4,696.5 | 4,025.6 | 4,577.4 | 4,563.4 | 4,701.2 | 4,726.3 | 4,751.6 | 4,777.0 | 4,802.5 | 4,828.2 |
| Revenue Growth, % | 0 | -14.28 | 13.71 | -0.30711 | 3.02 | 0.53434 | 0.53434 | 0.53434 | 0.53434 | 0.53434 |
| EBITDA | 291.5 | 496.6 | 662.5 | 513.1 | 378.5 | 494.5 | 497.1 | 499.8 | 502.5 | 505.1 |
| EBITDA, % | 6.21 | 12.34 | 14.47 | 11.24 | 8.05 | 10.46 | 10.46 | 10.46 | 10.46 | 10.46 |
| Depreciation | 257.0 | 238.7 | 233.7 | 229.3 | 229.9 | 249.7 | 251.1 | 252.4 | 253.8 | 255.1 |
| Depreciation, % | 5.47 | 5.93 | 5.11 | 5.02 | 4.89 | 5.28 | 5.28 | 5.28 | 5.28 | 5.28 |
| EBIT | 34.5 | 258.0 | 428.8 | 283.8 | 148.6 | 244.7 | 246.0 | 247.4 | 248.7 | 250.0 |
| EBIT, % | 0.73513 | 6.41 | 9.37 | 6.22 | 3.16 | 5.18 | 5.18 | 5.18 | 5.18 | 5.18 |
| Total Cash | 1,842.9 | 1,420.5 | 2,355.5 | 2,536.2 | 2,529.9 | 2,224.9 | 2,236.8 | 2,248.8 | 2,260.8 | 2,272.9 |
| Total Cash, percent | .0 | .0 | .0 | .0 | .0 | .0 | .0 | .0 | .0 | .0 |
| Account Receivables | 4,656.1 | 5,188.3 | 5,319.2 | 4,527.6 | 4,518.2 | 4,674.0 | 4,699.0 | 4,724.1 | 4,749.3 | 4,774.7 |
| Account Receivables, % | 99.14 | 128.88 | 116.21 | 99.22 | 96.11 | 98.89 | 98.89 | 98.89 | 98.89 | 98.89 |
| Inventories | 1,926.4 | 2,180.6 | 2,148.9 | 2,287.5 | 2,624.3 | 2,345.0 | 2,357.6 | 2,370.2 | 2,382.8 | 2,395.6 |
| Inventories, % | 41.02 | 54.17 | 46.95 | 50.13 | 55.82 | 49.62 | 49.62 | 49.62 | 49.62 | 49.62 |
| Accounts Payable | 3,473.1 | 3,260.5 | 3,381.0 | 3,541.5 | 3,703.2 | 3,641.1 | 3,660.5 | 3,680.1 | 3,699.7 | 3,719.5 |
| Accounts Payable, % | 73.95 | 81 | 73.86 | 77.61 | 78.77 | 77.04 | 77.04 | 77.04 | 77.04 | 77.04 |
| Capital Expenditure | -66.7 | -82.8 | -435.5 | -236.6 | -276.8 | -227.5 | -228.7 | -229.9 | -231.1 | -232.4 |
| Capital Expenditure, % | -1.42 | -2.06 | -9.51 | -5.18 | -5.89 | -4.81 | -4.81 | -4.81 | -4.81 | -4.81 |
| Tax Rate, % | 6.46 | 6.46 | 6.46 | 6.46 | 6.46 | 6.46 | 6.46 | 6.46 | 6.46 | 6.46 |
| EBITAT | 18.5 | 143.3 | 360.0 | 264.1 | 139.0 | 185.8 | 186.8 | 187.8 | 188.8 | 189.8 |
| Depreciation | ||||||||||
| Changes in Account Receivables | ||||||||||
| Changes in Inventories | ||||||||||
| Changes in Accounts Payable | ||||||||||
| Capital Expenditure | ||||||||||
| UFCF | -2,900.6 | -699.9 | 179.4 | 1,070.5 | -73.6 | 269.4 | 191.2 | 192.2 | 193.2 | 194.2 |
| WACC, % | 5.55 | 5.56 | 5.69 | 5.74 | 5.74 | 5.66 | 5.66 | 5.66 | 5.66 | 5.66 |
| PV UFCF | ||||||||||
| SUM PV UFCF | 891.7 | |||||||||
| Long Term Growth Rate, % | 4.00 | |||||||||
| Free cash flow (T + 1) | 202 | |||||||||
| Terminal Value | 12,188 | |||||||||
| Present Terminal Value | 9,256 | |||||||||
| Enterprise Value | 10,148 | |||||||||
| Net Debt | 129 | |||||||||
| Equity Value | 10,019 | |||||||||
| Diluted Shares Outstanding, MM | 1,310 | |||||||||
| Equity Value Per Share | 7.65 |
What You Will Receive
- Pre-Filled Financial Model: Utilizes Xiangtan Electric Manufacturing's actual data for accurate DCF valuation.
- Complete Forecast Control: Modify revenue growth, profit margins, WACC, and other critical assumptions.
- Real-Time Calculations: Immediate updates provide insights as you adjust parameters.
- Professional-Grade Template: A polished Excel workbook crafted for investment valuation presentations.
- Customizable and Repeatable: Designed for adaptability, allowing for extensive forecasts with ease.
Key Features
- Comprehensive 600416SS Data: Pre-loaded with Xiangtan Electric Manufacturing's historical financials and future projections.
- Fully Customizable Inputs: Tailor revenue growth, profit margins, WACC, tax rates, and capital expenditures to your analysis.
- Dynamic Valuation Model: Instant updates to Net Present Value (NPV) and intrinsic value based on your customized inputs.
- Scenario Analysis: Develop various forecast scenarios to assess different valuation results.
- User-Friendly Interface: Intuitive, organized, and optimized for both experienced professionals and newcomers.
How It Works
- Step 1: Download the Excel file for Xiangtan Electric Manufacturing Co. Ltd. (600416SS).
- Step 2: Review the pre-filled financial data and forecasts for Xiangtan Electric.
- Step 3: Adjust key inputs such as revenue growth, WACC, and tax rates (highlighted cells).
- Step 4: Observe the DCF model update in real-time as you modify your assumptions.
- Step 5: Analyze the results and leverage them for your investment decisions.
Why Choose This Calculator for Xiangtan Electric Manufacturing Co. Ltd. (600416SS)?
- Accurate Data: Up-to-date financial information from Xiangtan Electric provides trustworthy valuation outcomes.
- Customizable: Tailor essential inputs like growth estimates, WACC, and tax rates to align with your projections.
- Time-Saving: Pre-configured calculations save you the hassle of starting from the beginning.
- Professional-Grade Tool: Crafted for investors, analysts, and consultants working with Xiangtan Electric.
- User-Friendly: Easy-to-navigate layout and clear instructions ensure accessibility for all users.
Who Can Benefit from This Product?
- Individual Investors: Gain insights to make well-informed decisions regarding investments in Xiangtan Electric Manufacturing Co. Ltd. (600416SS).
- Financial Analysts: Enhance valuation methodologies with comprehensive financial models tailored for Xiangtan Electric (600416SS).
- Consultants: Provide timely and precise valuation analyses for clients focused on Xiangtan Electric (600416SS).
- Business Owners: Learn how the valuation of major players like Xiangtan Electric (600416SS) can influence your business strategy.
- Finance Students: Explore valuation principles through practical examples and data involving Xiangtan Electric (600416SS).
Contents of the Template
- Preloaded 600416SS Data: Historical and projected financial information, encompassing revenue, EBIT, and capital expenditures.
- DCF and WACC Models: Expert-level spreadsheets designed for calculating intrinsic value and Weighted Average Cost of Capital.
- Editable Inputs: Cells highlighted in yellow for modifying revenue growth rates, tax rates, and discount rates.
- Financial Statements: Detailed annual and quarterly financial statements for an in-depth analysis.
- Key Ratios: Ratios assessing profitability, leverage, and efficiency to gauge performance.
- Dashboard and Charts: Visual representations of valuation results and underlying assumptions.
Disclaimer
All information, articles, and product details provided on this website are for general informational and educational purposes only. We do not claim any ownership over, nor do we intend to infringe upon, any trademarks, copyrights, logos, brand names, or other intellectual property mentioned or depicted on this site. Such intellectual property remains the property of its respective owners, and any references here are made solely for identification or informational purposes, without implying any affiliation, endorsement, or partnership.
We make no representations or warranties, express or implied, regarding the accuracy, completeness, or suitability of any content or products presented. Nothing on this website should be construed as legal, tax, investment, financial, medical, or other professional advice. In addition, no part of this site—including articles or product references—constitutes a solicitation, recommendation, endorsement, advertisement, or offer to buy or sell any securities, franchises, or other financial instruments, particularly in jurisdictions where such activity would be unlawful.
All content is of a general nature and may not address the specific circumstances of any individual or entity. It is not a substitute for professional advice or services. Any actions you take based on the information provided here are strictly at your own risk. You accept full responsibility for any decisions or outcomes arising from your use of this website and agree to release us from any liability in connection with your use of, or reliance upon, the content or products found herein.