
|
Anhui Jianghuai Automobile Group Corp., Ltd. (600418.SS) Avaliação do DCF |
Totalmente Editável: Adapte-Se Às Suas Necessidades No Excel Ou Planilhas
Design Profissional: Modelos Confiáveis E Padrão Da Indústria
Pré-Construídos Para Uso Rápido E Eficiente
Compatível com MAC/PC, totalmente desbloqueado
Não É Necessária Experiência; Fácil De Seguir
Anhui Jianghuai Automobile Group Corp.,Ltd. (600418.SS) Bundle
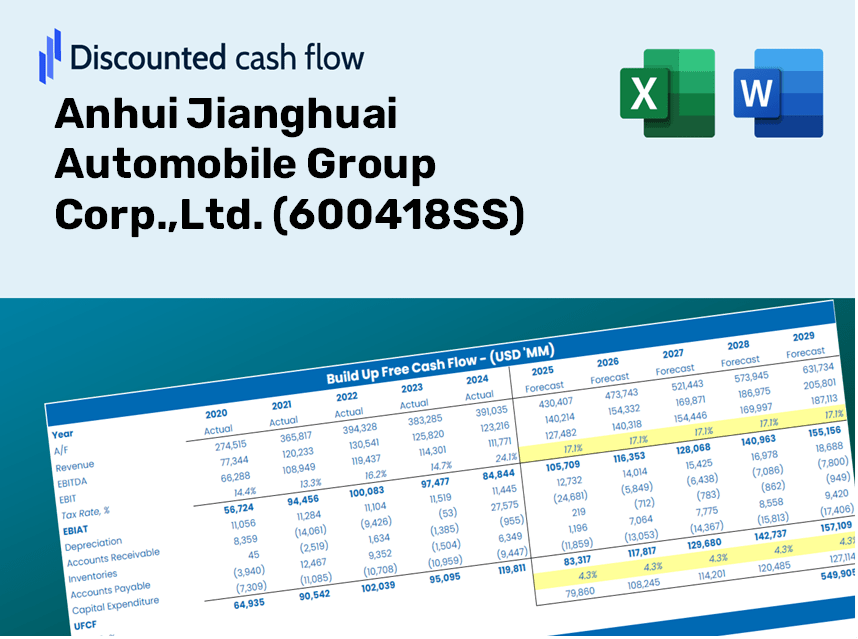
Seja você um investidor ou analista, esta calculadora DCF (600418SS) é a sua ferramenta essencial para uma avaliação precisa. Carregado com dados reais da Anhui Jianghuai Automobile Group Corp., Ltd., Você pode ajustar as previsões e visualizar os efeitos em tempo real.
What You Will Receive
- Authentic JAC Data: Preloaded financial information – encompassing revenue and EBIT – derived from actual and forecasted figures.
- Comprehensive Customization: Modify all key parameters (yellow cells) such as WACC, growth %, and tax rates.
- Instant Valuation Adjustments: Automatic recalculations to evaluate the impact of changes on JAC’s fair value.
- Flexible Excel Template: Designed for quick modifications, scenario analysis, and in-depth projections.
- Time-Efficient and Precise: Avoid the hassle of creating models from the ground up while ensuring accuracy and adaptability.
Key Features
- Comprehensive DCF Calculator: Features detailed unlevered and levered DCF valuation models tailored for Anhui Jianghuai Automobile Group Corp., Ltd. (600418SS).
- WACC Calculation Tool: Includes a pre-built Weighted Average Cost of Capital sheet with customizable parameters.
- Customizable Forecast Inputs: Adjust growth rates, capital expenditures, and discount rates as needed.
- Integrated Financial Ratios: Evaluate profitability, leverage, and efficiency ratios specific to Anhui Jianghuai Automobile Group Corp., Ltd. (600418SS).
- Interactive Dashboard and Charts: Visual representations of essential valuation metrics for streamlined analysis.
How It Works
- Step 1: Download the prebuilt Excel template featuring data for Anhui Jianghuai Automobile Group Corp.,Ltd. (600418SS).
- Step 2: Review the pre-filled sheets to familiarize yourself with the key performance metrics.
- Step 3: Modify the forecasts and assumptions in the editable yellow cells (WACC, growth, margins).
- Step 4: Instantly see the updated results, including the intrinsic value of Anhui Jianghuai Automobile Group Corp.,Ltd. (600418SS).
- Step 5: Use the outputs to make well-informed investment decisions or generate detailed reports.
Why Choose This Calculator for Anhui Jianghuai Automobile Group Corp.,Ltd. (600418SS)?
- All-in-One Solution: Combines DCF, WACC, and financial ratio analyses in a single tool.
- Flexible Inputs: Modify the yellow-highlighted cells to explore different scenarios.
- Comprehensive Analysis: Automatically computes the intrinsic value and Net Present Value for Anhui Jianghuai.
- Preloaded Information: Historical and projected data provide reliable starting points.
- High-Quality Standards: Perfect for financial analysts, investors, and business advisors.
Who Should Use This Product?
- Individual Investors: Make educated choices regarding the purchase or sale of Anhui Jianghuai Automobile Group Corp., Ltd. (600418SS) stock.
- Financial Analysts: Enhance valuation methodologies with pre-built financial models for Anhui Jianghuai Automobile Group Corp., Ltd. (600418SS).
- Consultants: Provide clients with accurate and timely valuation insights related to Anhui Jianghuai Automobile Group Corp., Ltd. (600418SS).
- Business Owners: Gain insights into the valuation of major companies like Anhui Jianghuai Automobile Group Corp., Ltd. (600418SS) to inform your own business strategies.
- Finance Students: Study valuation principles using real-time data and case studies from Anhui Jianghuai Automobile Group Corp., Ltd. (600418SS).
Contents of the Template
- Detailed DCF Model: A customizable template featuring extensive valuation calculations.
- Real-World Data: Anhui Jianghuai Automobile Group Corp., Ltd.'s historical and projected financials preloaded for analysis.
- Adjustable Parameters: Modify WACC, growth rates, and tax assumptions to explore different scenarios.
- Financial Statements: Complete annual and quarterly financial breakdowns for enhanced insights.
- Key Ratios: Integrated analysis covering profitability, efficiency, and leverage metrics.
- Dashboard with Visual Outputs: Graphs and tables that provide clear and actionable results.
Disclaimer
All information, articles, and product details provided on this website are for general informational and educational purposes only. We do not claim any ownership over, nor do we intend to infringe upon, any trademarks, copyrights, logos, brand names, or other intellectual property mentioned or depicted on this site. Such intellectual property remains the property of its respective owners, and any references here are made solely for identification or informational purposes, without implying any affiliation, endorsement, or partnership.
We make no representations or warranties, express or implied, regarding the accuracy, completeness, or suitability of any content or products presented. Nothing on this website should be construed as legal, tax, investment, financial, medical, or other professional advice. In addition, no part of this site—including articles or product references—constitutes a solicitation, recommendation, endorsement, advertisement, or offer to buy or sell any securities, franchises, or other financial instruments, particularly in jurisdictions where such activity would be unlawful.
All content is of a general nature and may not address the specific circumstances of any individual or entity. It is not a substitute for professional advice or services. Any actions you take based on the information provided here are strictly at your own risk. You accept full responsibility for any decisions or outcomes arising from your use of this website and agree to release us from any liability in connection with your use of, or reliance upon, the content or products found herein.