
|
Xinjiang Qingsong Materiais de construção e Chemicals Co, Ltd. (600425.SS) Avaliação DCF |
Totalmente Editável: Adapte-Se Às Suas Necessidades No Excel Ou Planilhas
Design Profissional: Modelos Confiáveis E Padrão Da Indústria
Pré-Construídos Para Uso Rápido E Eficiente
Compatível com MAC/PC, totalmente desbloqueado
Não É Necessária Experiência; Fácil De Seguir
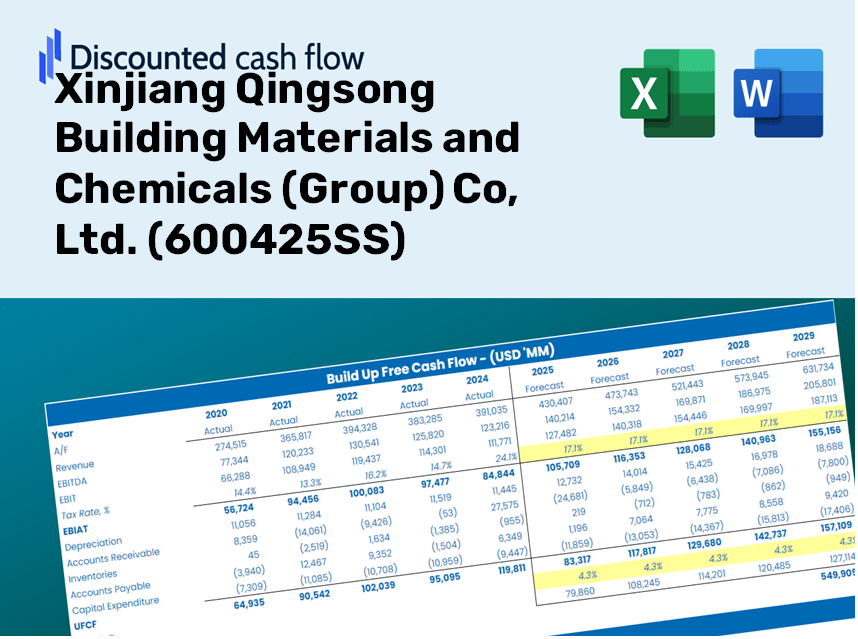
Xinjiang Qingsong Building Materials and Chemicals (Group) Co, Ltd. (600425.SS) Bundle
Maximize a eficiência e melhore a precisão com a calculadora DCF (600425SS)! Utilizando dados reais da Xinjiang Qingsong Materiais de construção e produtos químicos (Grupo) Co, Ltd. e suposições personalizáveis, essa ferramenta capacita você a prever, analisar e valorizar (600425Ss) como um investidor experiente.
Discounted Cash Flow (DCF) - (USD MM)
| Year | AY1 2020 |
AY2 2021 |
AY3 2022 |
AY4 2023 |
AY5 2024 |
FY1 2025 |
FY2 2026 |
FY3 2027 |
FY4 2028 |
FY5 2029 |
|---|---|---|---|---|---|---|---|---|---|---|
| Revenue | 3,034.6 | 3,911.8 | 3,741.1 | 4,489.8 | 4,328.2 | 4,265.5 | 4,203.8 | 4,143.0 | 4,083.1 | 4,024.0 |
| Revenue Growth, % | 0 | 28.9 | -4.36 | 20.01 | -3.6 | -1.45 | -1.45 | -1.45 | -1.45 | -1.45 |
| EBITDA | 817.1 | 816.3 | 860.7 | 961.5 | 871.8 | 958.5 | 944.7 | 931.0 | 917.5 | 904.3 |
| EBITDA, % | 26.92 | 20.87 | 23.01 | 21.42 | 20.14 | 22.47 | 22.47 | 22.47 | 22.47 | 22.47 |
| Depreciation | 315.5 | 299.7 | 311.6 | 330.2 | 365.3 | 359.9 | 354.7 | 349.5 | 344.5 | 339.5 |
| Depreciation, % | 10.4 | 7.66 | 8.33 | 7.35 | 8.44 | 8.44 | 8.44 | 8.44 | 8.44 | 8.44 |
| EBIT | 501.5 | 516.7 | 549.1 | 631.3 | 506.5 | 598.7 | 590.0 | 581.5 | 573.1 | 564.8 |
| EBIT, % | 16.53 | 13.21 | 14.68 | 14.06 | 11.7 | 14.04 | 14.04 | 14.04 | 14.04 | 14.04 |
| Total Cash | 1,092.1 | 1,270.2 | 1,027.3 | 1,611.2 | 1,273.1 | 1,375.4 | 1,355.5 | 1,335.9 | 1,316.6 | 1,297.5 |
| Total Cash, percent | .0 | .0 | .0 | .0 | .0 | .0 | .0 | .0 | .0 | .0 |
| Account Receivables | 404.7 | 484.6 | 921.7 | 1,083.2 | 1,087.7 | 849.8 | 837.6 | 825.4 | 813.5 | 801.7 |
| Account Receivables, % | 13.34 | 12.39 | 24.64 | 24.13 | 25.13 | 19.92 | 19.92 | 19.92 | 19.92 | 19.92 |
| Inventories | 455.6 | 599.6 | 870.9 | 722.4 | 642.6 | 721.4 | 710.9 | 700.6 | 690.5 | 680.5 |
| Inventories, % | 15.01 | 15.33 | 23.28 | 16.09 | 14.85 | 16.91 | 16.91 | 16.91 | 16.91 | 16.91 |
| Accounts Payable | 465.0 | 533.6 | 89.2 | 514.8 | 517.3 | 467.2 | 460.5 | 453.8 | 447.2 | 440.8 |
| Accounts Payable, % | 15.32 | 13.64 | 2.38 | 11.47 | 11.95 | 10.95 | 10.95 | 10.95 | 10.95 | 10.95 |
| Capital Expenditure | -131.3 | -132.3 | -169.7 | -199.1 | -247.4 | -191.1 | -188.3 | -185.6 | -182.9 | -180.2 |
| Capital Expenditure, % | -4.33 | -3.38 | -4.54 | -4.44 | -5.72 | -4.48 | -4.48 | -4.48 | -4.48 | -4.48 |
| Tax Rate, % | 22.44 | 22.44 | 22.44 | 22.44 | 22.44 | 22.44 | 22.44 | 22.44 | 22.44 | 22.44 |
| EBITAT | 331.6 | 381.1 | 461.6 | 508.9 | 392.9 | 457.5 | 450.9 | 444.4 | 438.0 | 431.6 |
| Depreciation | ||||||||||
| Changes in Account Receivables | ||||||||||
| Changes in Inventories | ||||||||||
| Changes in Accounts Payable | ||||||||||
| Capital Expenditure | ||||||||||
| UFCF | 120.6 | 393.3 | -549.4 | 1,052.7 | 588.5 | 735.3 | 633.3 | 624.1 | 615.1 | 606.2 |
| WACC, % | 5.13 | 5.17 | 5.23 | 5.21 | 5.2 | 5.19 | 5.19 | 5.19 | 5.19 | 5.19 |
| PV UFCF | ||||||||||
| SUM PV UFCF | 2,780.7 | |||||||||
| Long Term Growth Rate, % | 3.50 | |||||||||
| Free cash flow (T + 1) | 627 | |||||||||
| Terminal Value | 37,161 | |||||||||
| Present Terminal Value | 28,857 | |||||||||
| Enterprise Value | 31,638 | |||||||||
| Net Debt | 34 | |||||||||
| Equity Value | 31,604 | |||||||||
| Diluted Shares Outstanding, MM | 1,608 | |||||||||
| Equity Value Per Share | 19.66 |
What You Will Receive
- Genuine XQBC Financials: Access to both historical and projected data for precise valuation.
- Customizable Parameters: Adjust WACC, tax rates, revenue growth, and capital investments.
- Instantaneous Calculations: Intrinsic value and NPV calculated in real-time.
- Scenario Evaluation: Experiment with various scenarios to assess the future performance of Xinjiang Qingsong (600425SS).
- User-Friendly Layout: Designed for experts while remaining accessible for newcomers.
Key Features
- Comprehensive Historical Data: Pre-loaded with Xinjiang Qingsong Building Materials and Chemicals (Group) Co, Ltd.’s financial history and future projections.
- Flexible Input Options: Tailor revenue growth, profit margins, WACC, tax rates, and capital expenditures to fit your analysis needs.
- Interactive Valuation Model: Automatically recalculates Net Present Value (NPV) and intrinsic value based on the adjustments you make.
- What-If Analysis: Develop various forecast scenarios to explore different potential valuation results.
- Intuitive User Interface: Designed for ease of use, catering to both industry professionals and novices.
How It Works
- 1. Access the Template: Download and open the Excel file featuring Xinjiang Qingsong Building Materials and Chemicals (Group) Co, Ltd. (600425SS) preloaded data.
- 2. Modify Key Inputs: Adjust essential parameters such as growth rates, WACC, and capital expenditures to fit your analysis.
- 3. Analyze Results Immediately: The DCF model automatically computes the intrinsic value and NPV in real-time.
- 4. Explore Different Scenarios: Evaluate various forecasts to assess different valuation results for informed decision-making.
- 5. Present with Assurance: Share professional valuation insights to back up your strategic choices.
Why Opt for This Calculator?
- Designed for Experts: An advanced tool favored by industry analysts, CFOs, and consultants.
- Comprehensive Data: Historical and projected financials for Xinjiang Qingsong Building Materials and Chemicals (Group) Co, Ltd. (600425SS) preloaded for precision.
- Flexible Scenario Analysis: Effortlessly test various forecasts and assumptions.
- Insightful Outputs: Automatically computes intrinsic value, NPV, and essential metrics.
- User-Friendly: Clear step-by-step guidance assists you throughout the process.
Who Can Benefit from This Product?
- Construction Management Students: Master essential valuation techniques using real-world data relevant to building materials.
- Researchers: Integrate advanced professional models into your academic studies or projects.
- Investors: Validate your investment hypotheses and evaluate valuation results for Xinjiang Qingsong Building Materials and Chemicals (Group) Co, Ltd. (600425SS).
- Financial Analysts: Enhance your analytical processes with a customizable, ready-made DCF model.
- Small Manufacturers: Learn how major companies like Xinjiang Qingsong are assessed in the market.
Contents of the Template
- Operating and Balance Sheet Data: Pre-filled historical data and forecasts for Xinjiang Qingsong Building Materials and Chemicals (Group) Co, Ltd. (600425SS), including revenue, EBITDA, EBIT, and capital expenditures.
- WACC Calculation: A dedicated sheet for calculating the Weighted Average Cost of Capital (WACC), featuring parameters such as Beta, risk-free rate, and share price.
- DCF Valuation (Unlevered and Levered): Customizable Discounted Cash Flow models that present the intrinsic value along with detailed calculations.
- Financial Statements: Pre-loaded annual and quarterly financial statements to facilitate thorough analysis.
- Key Ratios: Includes profitability, leverage, and efficiency ratios specific to Xinjiang Qingsong Building Materials and Chemicals (Group) Co, Ltd. (600425SS).
- Dashboard and Charts: Visual representation of valuation outcomes and underlying assumptions for easy result analysis.
Disclaimer
All information, articles, and product details provided on this website are for general informational and educational purposes only. We do not claim any ownership over, nor do we intend to infringe upon, any trademarks, copyrights, logos, brand names, or other intellectual property mentioned or depicted on this site. Such intellectual property remains the property of its respective owners, and any references here are made solely for identification or informational purposes, without implying any affiliation, endorsement, or partnership.
We make no representations or warranties, express or implied, regarding the accuracy, completeness, or suitability of any content or products presented. Nothing on this website should be construed as legal, tax, investment, financial, medical, or other professional advice. In addition, no part of this site—including articles or product references—constitutes a solicitation, recommendation, endorsement, advertisement, or offer to buy or sell any securities, franchises, or other financial instruments, particularly in jurisdictions where such activity would be unlawful.
All content is of a general nature and may not address the specific circumstances of any individual or entity. It is not a substitute for professional advice or services. Any actions you take based on the information provided here are strictly at your own risk. You accept full responsibility for any decisions or outcomes arising from your use of this website and agree to release us from any liability in connection with your use of, or reliance upon, the content or products found herein.