
|
Shandong Hualu-Hengsheng Chemical Co., Ltd. (600426.SS) DCF Avaliação |
Totalmente Editável: Adapte-Se Às Suas Necessidades No Excel Ou Planilhas
Design Profissional: Modelos Confiáveis E Padrão Da Indústria
Pré-Construídos Para Uso Rápido E Eficiente
Compatível com MAC/PC, totalmente desbloqueado
Não É Necessária Experiência; Fácil De Seguir
Shandong Hualu-Hengsheng Chemical Co., Ltd. (600426.SS) Bundle
Para investidores e analistas, essa calculadora (600426Ss) DCF serve como sua ferramenta essencial para uma avaliação precisa. Apresentando dados reais da Shandong Hualu-Hengsheng Chemical Co., Ltd., você pode ajustar facilmente as previsões e observar os efeitos em tempo real.
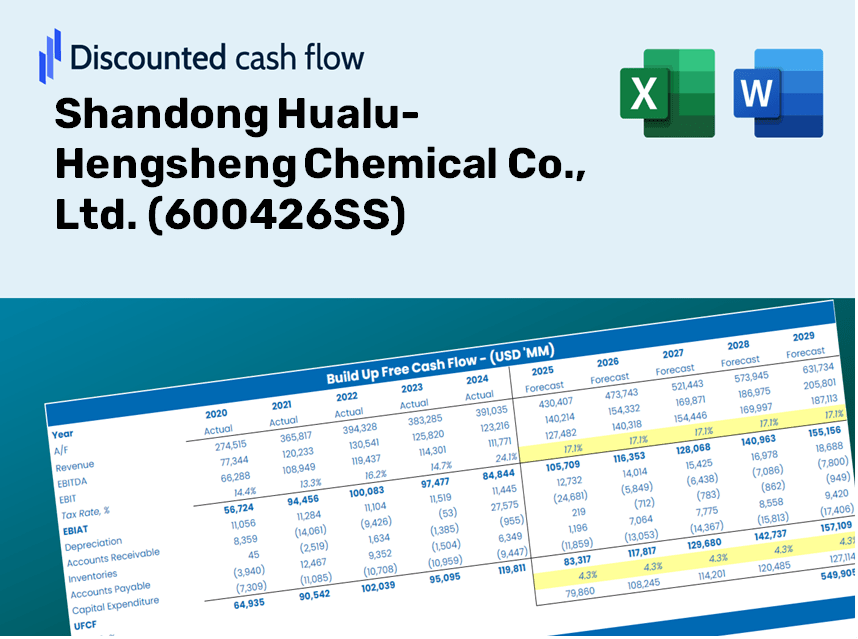
Discounted Cash Flow (DCF) - (USD MM)
| Year | AY1 2020 |
AY2 2021 |
AY3 2022 |
AY4 2023 |
AY5 2024 |
FY1 2025 |
FY2 2026 |
FY3 2027 |
FY4 2028 |
FY5 2029 |
|---|---|---|---|---|---|---|---|---|---|---|
| Revenue | 13,115.0 | 26,744.4 | 30,245.3 | 27,259.9 | 34,226.0 | 45,244.6 | 59,810.4 | 79,065.5 | 104,519.5 | 138,168.0 |
| Revenue Growth, % | 0 | 103.92 | 13.09 | -9.87 | 25.55 | 32.19 | 32.19 | 32.19 | 32.19 | 32.19 |
| EBITDA | 3,488.6 | 9,993.9 | 9,371.1 | 6,376.6 | 7,975.5 | 12,817.4 | 16,943.8 | 22,398.6 | 29,609.5 | 39,141.9 |
| EBITDA, % | 26.6 | 37.37 | 30.98 | 23.39 | 23.3 | 28.33 | 28.33 | 28.33 | 28.33 | 28.33 |
| Depreciation | 1,298.5 | 1,407.9 | 1,763.7 | 1,888.5 | 2,747.4 | 3,253.2 | 4,300.6 | 5,685.1 | 7,515.3 | 9,934.7 |
| Depreciation, % | 9.9 | 5.26 | 5.83 | 6.93 | 8.03 | 7.19 | 7.19 | 7.19 | 7.19 | 7.19 |
| EBIT | 2,190.1 | 8,586.0 | 7,607.4 | 4,488.0 | 5,228.1 | 9,564.2 | 12,643.3 | 16,713.6 | 22,094.3 | 29,207.2 |
| EBIT, % | 16.7 | 32.1 | 25.15 | 16.46 | 15.28 | 21.14 | 21.14 | 21.14 | 21.14 | 21.14 |
| Total Cash | 2,070.5 | 2,889.0 | 3,255.1 | 2,041.2 | 1,397.8 | 4,427.1 | 5,852.3 | 7,736.4 | 10,227.0 | 13,519.4 |
| Total Cash, percent | .0 | .0 | .0 | .0 | .0 | .0 | .0 | .0 | .0 | .0 |
| Account Receivables | 462.2 | 3,861.8 | 2,961.3 | 2,360.2 | 2,025.3 | 3,830.5 | 5,063.6 | 6,693.8 | 8,848.7 | 11,697.5 |
| Account Receivables, % | 3.52 | 14.44 | 9.79 | 8.66 | 5.92 | 8.47 | 8.47 | 8.47 | 8.47 | 8.47 |
| Inventories | 273.4 | 1,038.6 | 1,173.1 | 1,493.0 | 1,318.8 | 1,735.3 | 2,294.0 | 3,032.5 | 4,008.8 | 5,299.3 |
| Inventories, % | 2.08 | 3.88 | 3.88 | 5.48 | 3.85 | 3.84 | 3.84 | 3.84 | 3.84 | 3.84 |
| Accounts Payable | 1,458.4 | 2,192.1 | 1,624.1 | 3,807.3 | 1,799.1 | 3,973.3 | 5,252.5 | 6,943.4 | 9,178.8 | 12,133.7 |
| Accounts Payable, % | 11.12 | 8.2 | 5.37 | 13.97 | 5.26 | 8.78 | 8.78 | 8.78 | 8.78 | 8.78 |
| Capital Expenditure | -2,615.8 | -3,672.4 | -6,970.1 | -8,710.5 | -5,080.7 | -9,367.4 | -12,383.1 | -16,369.7 | -21,639.7 | -28,606.3 |
| Capital Expenditure, % | -19.94 | -13.73 | -23.05 | -31.95 | -14.84 | -20.7 | -20.7 | -20.7 | -20.7 | -20.7 |
| Tax Rate, % | 22.18 | 22.18 | 22.18 | 22.18 | 22.18 | 22.18 | 22.18 | 22.18 | 22.18 | 22.18 |
| EBITAT | 1,855.2 | 7,307.2 | 6,456.4 | 3,749.0 | 4,068.7 | 7,958.2 | 10,520.3 | 13,907.1 | 18,384.3 | 24,302.8 |
| Depreciation | ||||||||||
| Changes in Account Receivables | ||||||||||
| Changes in Inventories | ||||||||||
| Changes in Accounts Payable | ||||||||||
| Capital Expenditure | ||||||||||
| UFCF | 1,260.7 | 1,611.7 | 1,448.0 | -608.7 | 236.4 | 1,796.6 | 1,925.0 | 2,544.8 | 3,364.0 | 4,447.0 |
| WACC, % | 7.43 | 7.44 | 7.43 | 7.43 | 7.4 | 7.43 | 7.43 | 7.43 | 7.43 | 7.43 |
| PV UFCF | ||||||||||
| SUM PV UFCF | 11,027.3 | |||||||||
| Long Term Growth Rate, % | 0.50 | |||||||||
| Free cash flow (T + 1) | 4,469 | |||||||||
| Terminal Value | 64,527 | |||||||||
| Present Terminal Value | 45,102 | |||||||||
| Enterprise Value | 56,129 | |||||||||
| Net Debt | 6,873 | |||||||||
| Equity Value | 49,256 | |||||||||
| Diluted Shares Outstanding, MM | 2,115 | |||||||||
| Equity Value Per Share | 23.29 |
What You'll Receive
- Adjustable Forecast Parameters: Effortlessly modify key assumptions (growth %, profit margins, WACC) to explore various scenarios.
- Real-World Financial Data: Pre-populated financial information for Shandong Hualu-Hengsheng Chemical Co., Ltd. (600426SS) to kickstart your analysis.
- Automated DCF Calculations: The template computes Net Present Value (NPV) and intrinsic value automatically.
- Professional and Adaptable: A refined Excel model tailored to meet your valuation requirements.
- Designed for Analysts and Investors: Perfect for assessing projections, verifying strategies, and enhancing efficiency.
Key Features
- Comprehensive Historical Data: Shandong Hualu-Hengsheng Chemical Co., Ltd.’s financial records and pre-filled projections.
- Customizable Parameters: Modify WACC, tax rates, sales growth, and EBITDA margins as needed.
- Real-Time Calculations: Monitor the intrinsic value of Shandong Hualu-Hengsheng (600426SS) as it updates instantly.
- Visual Performance Metrics: Interactive dashboard charts showcase valuation outcomes and essential indicators.
- Designed for Precision: A reliable resource for analysts, investors, and finance professionals.
How It Functions
- Obtain the Template: Gain immediate access to the Excel-based DCF Calculator for Shandong Hualu-Hengsheng Chemical Co., Ltd. (600426SS).
- Adjust Your Inputs: Modify the yellow-highlighted cells to set growth rates, WACC, profit margins, and other variables.
- Automatic Calculations: The model instantly recalculates the intrinsic value of Shandong Hualu-Hengsheng Chemical Co., Ltd. (600426SS).
- Explore Scenarios: Test various assumptions to see how they impact the valuation outcomes.
- Evaluate and Decide: Leverage the results to inform your investment strategy or financial assessment.
Why Opt for This Calculator?
- Designed for Industry Experts: A sophisticated tool utilized by analysts, CFOs, and industry consultants.
- Accurate Financial Data: Historical and projected financials for Shandong Hualu-Hengsheng Chemical Co., Ltd. (600426SS) preloaded for precision.
- Versatile Scenario Analysis: Effortlessly simulate various forecasts and assumptions.
- Comprehensive Outputs: Automatically computes intrinsic value, NPV, and essential metrics.
- User-Friendly Interface: Step-by-step guidance ensures a smooth experience.
Who Can Benefit from This Product?
- Chemical Engineering Students: Master analytical techniques and apply them to real-world scenarios.
- Researchers: Utilize advanced models in your studies or publications related to chemical processes.
- Investors: Evaluate your investment strategies and assess valuation metrics for Shandong Hualu-Hengsheng Chemical Co., Ltd. (600426SS).
- Market Analysts: Enhance your efficiency with a customizable DCF model specifically designed for the chemical industry.
- Entrepreneurs: Understand how major chemical companies like Shandong Hualu-Hengsheng are evaluated in the market.
Contents of the Template
- Operating and Balance Sheet Data: Pre-filled historical data and forecasts for Shandong Hualu-Hengsheng Chemical Co., Ltd. (600426SS), including revenue, EBITDA, EBIT, and capital expenditures.
- WACC Calculation: A dedicated sheet for calculating the Weighted Average Cost of Capital (WACC), incorporating parameters such as Beta, risk-free rate, and share price.
- DCF Valuation (Unlevered and Levered): Editable Discounted Cash Flow models that detail intrinsic value with comprehensive calculations.
- Financial Statements: Pre-loaded financial statements (annual and quarterly) to facilitate thorough analysis.
- Key Ratios: Features profitability, leverage, and efficiency ratios specific to Shandong Hualu-Hengsheng Chemical Co., Ltd. (600426SS).
- Dashboard and Charts: A visual summary of valuation outputs and underlying assumptions for easy analysis of results.
Disclaimer
All information, articles, and product details provided on this website are for general informational and educational purposes only. We do not claim any ownership over, nor do we intend to infringe upon, any trademarks, copyrights, logos, brand names, or other intellectual property mentioned or depicted on this site. Such intellectual property remains the property of its respective owners, and any references here are made solely for identification or informational purposes, without implying any affiliation, endorsement, or partnership.
We make no representations or warranties, express or implied, regarding the accuracy, completeness, or suitability of any content or products presented. Nothing on this website should be construed as legal, tax, investment, financial, medical, or other professional advice. In addition, no part of this site—including articles or product references—constitutes a solicitation, recommendation, endorsement, advertisement, or offer to buy or sell any securities, franchises, or other financial instruments, particularly in jurisdictions where such activity would be unlawful.
All content is of a general nature and may not address the specific circumstances of any individual or entity. It is not a substitute for professional advice or services. Any actions you take based on the information provided here are strictly at your own risk. You accept full responsibility for any decisions or outcomes arising from your use of this website and agree to release us from any liability in connection with your use of, or reliance upon, the content or products found herein.