
|
Cosco Shipping Specialized Carriers Co., Ltd. (600428.SS) Avaliação do DCF |
Totalmente Editável: Adapte-Se Às Suas Necessidades No Excel Ou Planilhas
Design Profissional: Modelos Confiáveis E Padrão Da Indústria
Pré-Construídos Para Uso Rápido E Eficiente
Compatível com MAC/PC, totalmente desbloqueado
Não É Necessária Experiência; Fácil De Seguir
COSCO SHIPPING Specialized Carriers Co.,Ltd. (600428.SS) Bundle
Aprimore suas estratégias de investimento com a calculadora Cosco Shipping Specialized Carriers Co., Ltd. (600428SS)! Explore dados financeiros reais, ajuste as projeções e despesas de crescimento e observe instantaneamente como essas modificações afetam o valor intrínseco da Cosco Shipping Specialized Carriers Co., Ltd. (600428Ss).
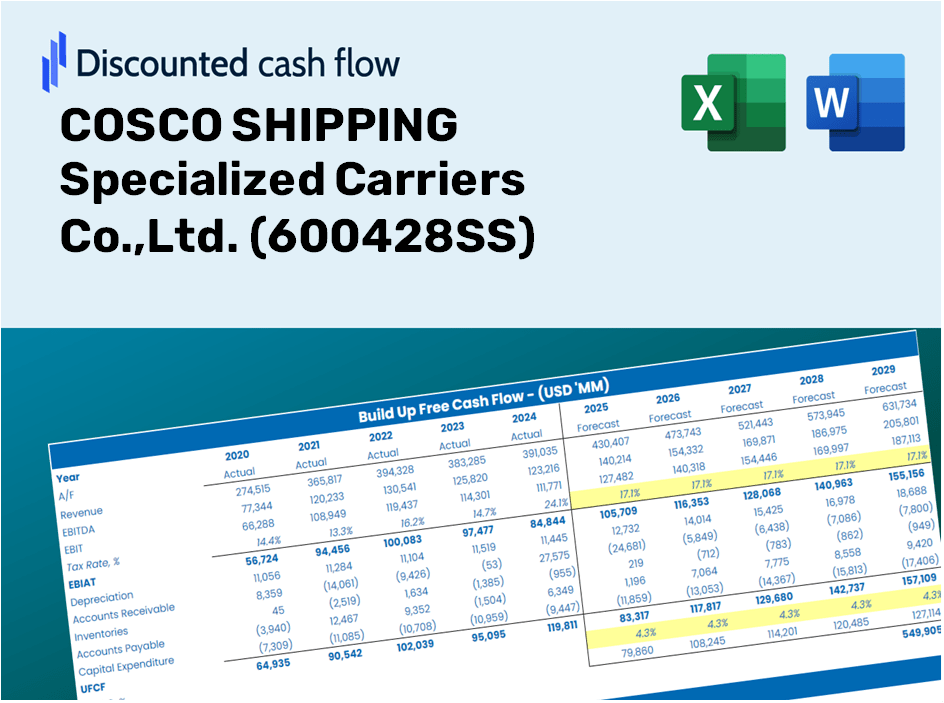
Discounted Cash Flow (DCF) - (USD MM)
| Year | AY1 2020 |
AY2 2021 |
AY3 2022 |
AY4 2023 |
AY5 2024 |
FY1 2025 |
FY2 2026 |
FY3 2027 |
FY4 2028 |
FY5 2029 |
|---|---|---|---|---|---|---|---|---|---|---|
| Revenue | 7,040.3 | 8,753.4 | 12,207.2 | 12,197.4 | 16,780.2 | 16,310.0 | 15,853.0 | 15,408.8 | 14,977.0 | 14,557.3 |
| Revenue Growth, % | 0 | 24.33 | 39.46 | -0.08034124 | 37.57 | -2.8 | -2.8 | -2.8 | -2.8 | -2.8 |
| EBITDA | 1,285.8 | 2,005.7 | 2,659.6 | 1,995.8 | 3,361.9 | 3,241.2 | 3,150.3 | 3,062.1 | 2,976.3 | 2,892.9 |
| EBITDA, % | 18.26 | 22.91 | 21.79 | 16.36 | 20.03 | 19.87 | 19.87 | 19.87 | 19.87 | 19.87 |
| Depreciation | 865.2 | 836.0 | 884.0 | 897.8 | 931.9 | 1,369.9 | 1,331.5 | 1,294.2 | 1,257.9 | 1,222.7 |
| Depreciation, % | 12.29 | 9.55 | 7.24 | 7.36 | 5.55 | 8.4 | 8.4 | 8.4 | 8.4 | 8.4 |
| EBIT | 420.6 | 1,169.6 | 1,775.6 | 1,098.0 | 2,430.0 | 1,871.3 | 1,818.8 | 1,767.9 | 1,718.3 | 1,670.2 |
| EBIT, % | 5.97 | 13.36 | 14.55 | 9 | 14.48 | 11.47 | 11.47 | 11.47 | 11.47 | 11.47 |
| Total Cash | 1,513.8 | 1,914.0 | 997.1 | 1,481.5 | 2,880.6 | 2,637.3 | 2,563.4 | 2,491.6 | 2,421.7 | 2,353.9 |
| Total Cash, percent | .0 | .0 | .0 | .0 | .0 | .0 | .0 | .0 | .0 | .0 |
| Account Receivables | 608.1 | 1,043.6 | 1,326.0 | 874.1 | 1,752.5 | 1,599.4 | 1,554.6 | 1,511.1 | 1,468.7 | 1,427.6 |
| Account Receivables, % | 8.64 | 11.92 | 10.86 | 7.17 | 10.44 | 9.81 | 9.81 | 9.81 | 9.81 | 9.81 |
| Inventories | 344.8 | 454.5 | 681.4 | 676.1 | 873.3 | 861.8 | 837.6 | 814.2 | 791.4 | 769.2 |
| Inventories, % | 4.9 | 5.19 | 5.58 | 5.54 | 5.2 | 5.28 | 5.28 | 5.28 | 5.28 | 5.28 |
| Accounts Payable | 1,309.9 | 1,703.4 | 1,994.8 | 1,912.0 | 2,438.1 | 2,760.1 | 2,682.7 | 2,607.5 | 2,534.5 | 2,463.5 |
| Accounts Payable, % | 18.61 | 19.46 | 16.34 | 15.68 | 14.53 | 16.92 | 16.92 | 16.92 | 16.92 | 16.92 |
| Capital Expenditure | -436.2 | -842.3 | -863.9 | -2,015.0 | -636.2 | -1,409.4 | -1,369.9 | -1,331.5 | -1,294.2 | -1,258.0 |
| Capital Expenditure, % | -6.2 | -9.62 | -7.08 | -16.52 | -3.79 | -8.64 | -8.64 | -8.64 | -8.64 | -8.64 |
| Tax Rate, % | 22.6 | 22.6 | 22.6 | 22.6 | 22.6 | 22.6 | 22.6 | 22.6 | 22.6 | 22.6 |
| EBITAT | 348.6 | 753.2 | 1,366.1 | 974.2 | 1,880.9 | 1,460.8 | 1,419.9 | 1,380.1 | 1,341.4 | 1,303.8 |
| Depreciation | ||||||||||
| Changes in Account Receivables | ||||||||||
| Changes in Inventories | ||||||||||
| Changes in Accounts Payable | ||||||||||
| Capital Expenditure | ||||||||||
| UFCF | 1,134.5 | 595.2 | 1,168.3 | 231.3 | 1,627.1 | 1,907.8 | 1,373.1 | 1,334.6 | 1,297.2 | 1,260.9 |
| WACC, % | 6.12 | 5.75 | 6 | 6.24 | 6.01 | 6.03 | 6.03 | 6.03 | 6.03 | 6.03 |
| PV UFCF | ||||||||||
| SUM PV UFCF | 6,107.9 | |||||||||
| Long Term Growth Rate, % | 3.50 | |||||||||
| Free cash flow (T + 1) | 1,305 | |||||||||
| Terminal Value | 51,640 | |||||||||
| Present Terminal Value | 38,539 | |||||||||
| Enterprise Value | 44,647 | |||||||||
| Net Debt | 8,319 | |||||||||
| Equity Value | 36,328 | |||||||||
| Diluted Shares Outstanding, MM | 2,147 | |||||||||
| Equity Value Per Share | 16.92 |
What You Will Receive
- Flexible Forecast Inputs: Effortlessly adjust key variables (growth %, margins, WACC) to generate various scenarios.
- Industry-Specific Data: COSCO SHIPPING Specialized Carriers Co., Ltd. financial data pre-populated for immediate analysis.
- Instant DCF Outputs: The model automatically computes Net Present Value (NPV) and intrinsic value for your convenience.
- Tailored and Professional: A refined Excel model that can be customized to meet your valuation requirements.
- Designed for Analysts and Investors: Perfect for evaluating projections, confirming strategies, and optimizing efficiency.
Key Features
- Authentic COSCO Data: Pre-loaded with COSCO SHIPPING Specialized Carriers Co., Ltd.’s historical performance metrics and future projections.
- Customizable Parameters: Tailor revenue growth, profit margins, discount rates, taxation, and capital investments to suit your analysis.
- Interactive Valuation Framework: Automatic recalculations of Net Present Value (NPV) and intrinsic value in response to your modifications.
- Scenario Analysis: Develop various forecasting scenarios to explore different valuation possibilities.
- Intuitive Interface: Streamlined and organized layout designed for both professionals and novices.
How It Functions
- Download: Obtain the pre-configured Excel file containing COSCO SHIPPING Specialized Carriers Co., Ltd.’s financial data (600428SS).
- Customize: Modify projections, such as revenue growth, EBITDA percentage, and WACC.
- Auto-Update: Intrinsic value and NPV calculations refresh automatically in real-time.
- Scenario Testing: Develop various projections and instantly compare the results.
- Make Informed Decisions: Leverage the valuation outputs to optimize your investment approach.
Why Choose This Calculator for COSCO SHIPPING Specialized Carriers Co., Ltd. (600428SS)?
- Designed for Experts: A sophisticated tool utilized by industry analysts, CFOs, and financial consultants.
- Accurate Financial Data: Preloaded with COSCO's historical and anticipated financial information for reliable results.
- Flexible Scenario Analysis: Effortlessly model various forecasts and assumptions.
- Comprehensive Outputs: Automatically computes intrinsic value, NPV, and essential financial metrics.
- User-Friendly: Step-by-step guidance simplifies the calculation process.
Who Should Use This Product?
- Investors: Accurately assess COSCO SHIPPING Specialized Carriers Co.,Ltd.'s (600428SS) fair value prior to making investment decisions.
- CFOs: Utilize a professional-grade DCF model for financial analysis and reporting specific to COSCO SHIPPING (600428SS).
- Consultants: Easily customize the template for valuation reports tailored to clients regarding COSCO SHIPPING (600428SS).
- Entrepreneurs: Gain valuable insights into the financial modeling practices of leading companies like COSCO SHIPPING (600428SS).
- Educators: Implement this tool as a resource to illustrate various valuation methodologies related to COSCO SHIPPING (600428SS).
Contents of the Template
- Operating and Balance Sheet Data: Pre-filled historical data and forecasts for COSCO SHIPPING Specialized Carriers Co., Ltd. (600428SS), including revenue, EBITDA, EBIT, and capital expenditures.
- WACC Calculation: A dedicated sheet for Weighted Average Cost of Capital (WACC), featuring parameters such as Beta, risk-free rate, and share price.
- DCF Valuation (Unlevered and Levered): Customizable Discounted Cash Flow models illustrating intrinsic value with comprehensive calculations.
- Financial Statements: Pre-loaded annual and quarterly financial statements to facilitate thorough analysis.
- Key Ratios: Covers profitability, leverage, and efficiency ratios relevant to COSCO SHIPPING Specialized Carriers Co., Ltd. (600428SS).
- Dashboard and Charts: Visual representation of valuation outputs and underlying assumptions for easy result analysis.
Disclaimer
All information, articles, and product details provided on this website are for general informational and educational purposes only. We do not claim any ownership over, nor do we intend to infringe upon, any trademarks, copyrights, logos, brand names, or other intellectual property mentioned or depicted on this site. Such intellectual property remains the property of its respective owners, and any references here are made solely for identification or informational purposes, without implying any affiliation, endorsement, or partnership.
We make no representations or warranties, express or implied, regarding the accuracy, completeness, or suitability of any content or products presented. Nothing on this website should be construed as legal, tax, investment, financial, medical, or other professional advice. In addition, no part of this site—including articles or product references—constitutes a solicitation, recommendation, endorsement, advertisement, or offer to buy or sell any securities, franchises, or other financial instruments, particularly in jurisdictions where such activity would be unlawful.
All content is of a general nature and may not address the specific circumstances of any individual or entity. It is not a substitute for professional advice or services. Any actions you take based on the information provided here are strictly at your own risk. You accept full responsibility for any decisions or outcomes arising from your use of this website and agree to release us from any liability in connection with your use of, or reliance upon, the content or products found herein.