
|
Tongwei Co., Ltd (600438.SS) DCF Avaliação |
Totalmente Editável: Adapte-Se Às Suas Necessidades No Excel Ou Planilhas
Design Profissional: Modelos Confiáveis E Padrão Da Indústria
Pré-Construídos Para Uso Rápido E Eficiente
Compatível com MAC/PC, totalmente desbloqueado
Não É Necessária Experiência; Fácil De Seguir
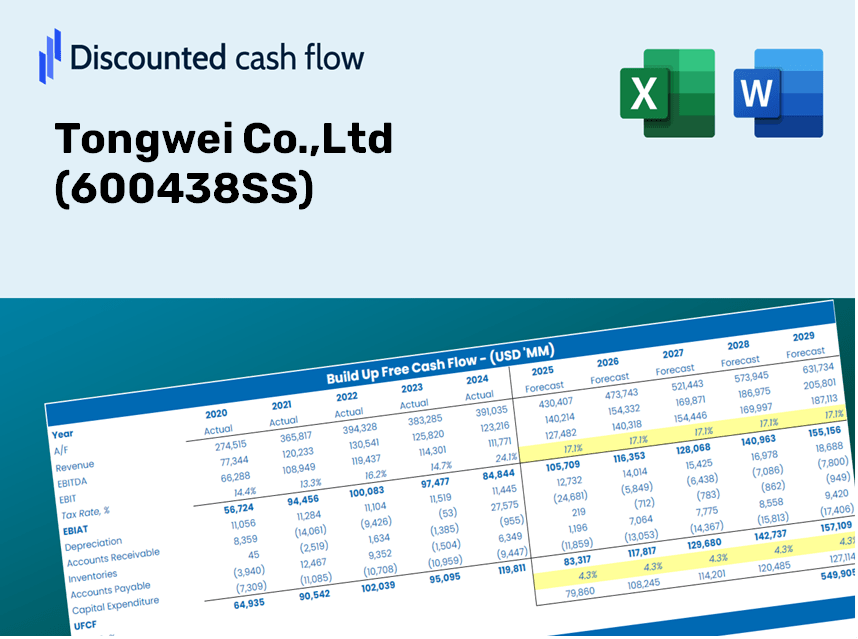
Tongwei Co.,Ltd (600438.SS) Bundle
Simplificar Tongwei Co., Ltd Avaliação com esta calculadora DCF personalizável! Apresentando o Real Tongwei Co., Ltd Financials e insumos de previsão ajustáveis, você pode testar cenários e descobrir o Tongwei Co., Ltd Valor justo em minutos.
What You Will Receive
- Accurate TW Financial Data: Pre-loaded with Tongwei Co., Ltd's historical and projected financial figures for detailed analysis.
- Customizable Template: Easily adjust essential inputs such as revenue growth, WACC, and EBITDA percentages.
- Instant Calculations: Watch the intrinsic value of Tongwei Co., Ltd. update in real-time as you make adjustments.
- Professional Valuation Tool: Tailored for investors, analysts, and consultants in need of precise DCF evaluations.
- User-Friendly Interface: Intuitive layout and straightforward instructions suitable for all skill levels.
Key Features
- Real-Time Tongwei Data: Pre-filled with Tongwei Co., Ltd's historical financials and forward-looking projections.
- Fully Customizable Inputs: Adjust revenue growth rates, profit margins, WACC, tax rates, and capital expenditures as needed.
- Dynamic Valuation Model: Automatically updates Net Present Value (NPV) and intrinsic value based on your customized inputs.
- Scenario Testing: Generate various forecast scenarios to explore different valuation results.
- User-Friendly Design: Intuitive, well-structured, and suitable for both professionals and beginners.
How It Operates
- Download the Template: Gain immediate access to the Excel-based Tongwei Co., Ltd. DCF Calculator.
- Input Your Assumptions: Modify the yellow-highlighted cells for growth rates, WACC, profit margins, and other variables.
- Instant Calculations: The model automatically recalculates Tongwei’s intrinsic value.
- Test Scenarios: Experiment with various assumptions to see how they impact valuation.
- Analyze and Decide: Utilize the findings to inform your investment or financial analysis decisions.
Why Choose This Calculator for Tongwei Co., Ltd (600438SS)?
- Precision: Leveraging actual financial data from Tongwei ensures precise results.
- Versatility: Users can freely experiment with and adjust inputs as needed.
- Efficiency: Eliminate the complexities of constructing a DCF model from the ground up.
- Expert-Level: Crafted with the meticulousness and functionality expected at the CFO level.
- Intuitive: Designed to be accessible for anyone, regardless of their financial modeling expertise.
Who Can Benefit from This Product?
- Investors: Accurately assess Tongwei Co., Ltd's (600438SS) fair value before making investment choices.
- CFOs: Utilize a professional-grade DCF model for comprehensive financial reporting and analysis.
- Consultants: Efficiently customize the template for valuation reports tailored to clients’ needs.
- Entrepreneurs: Discover insights into financial modeling practices employed by leading companies.
- Educators: Implement it as a resource to teach valuation methodologies effectively.
Contents of the Template
- Historical Data: Contains Tongwei Co., Ltd's past financials and baseline forecasts.
- DCF and Levered DCF Models: Comprehensive templates for assessing the intrinsic value of Tongwei Co., Ltd (600438SS).
- WACC Sheet: Pre-configured calculations for the Weighted Average Cost of Capital.
- Editable Inputs: Customize essential drivers such as growth rates, EBITDA %, and CAPEX assumptions.
- Quarterly and Annual Statements: An in-depth analysis of Tongwei Co., Ltd's financial performance.
- Interactive Dashboard: Visualize valuation outcomes and projections in an engaging format.
Disclaimer
All information, articles, and product details provided on this website are for general informational and educational purposes only. We do not claim any ownership over, nor do we intend to infringe upon, any trademarks, copyrights, logos, brand names, or other intellectual property mentioned or depicted on this site. Such intellectual property remains the property of its respective owners, and any references here are made solely for identification or informational purposes, without implying any affiliation, endorsement, or partnership.
We make no representations or warranties, express or implied, regarding the accuracy, completeness, or suitability of any content or products presented. Nothing on this website should be construed as legal, tax, investment, financial, medical, or other professional advice. In addition, no part of this site—including articles or product references—constitutes a solicitation, recommendation, endorsement, advertisement, or offer to buy or sell any securities, franchises, or other financial instruments, particularly in jurisdictions where such activity would be unlawful.
All content is of a general nature and may not address the specific circumstances of any individual or entity. It is not a substitute for professional advice or services. Any actions you take based on the information provided here are strictly at your own risk. You accept full responsibility for any decisions or outcomes arising from your use of this website and agree to release us from any liability in connection with your use of, or reliance upon, the content or products found herein.