
|
Chongqing Fuling Electric Power Industrial Co., Ltd. (600452.SS) Avaliação DCF |
Totalmente Editável: Adapte-Se Às Suas Necessidades No Excel Ou Planilhas
Design Profissional: Modelos Confiáveis E Padrão Da Indústria
Pré-Construídos Para Uso Rápido E Eficiente
Compatível com MAC/PC, totalmente desbloqueado
Não É Necessária Experiência; Fácil De Seguir
Chongqing Fuling Electric Power Industrial Co., Ltd. (600452.SS) Bundle
Aprimore sua estratégia de investimento com a calculadora (600452SS) DCF! Utilize dados financeiros reais da Chongqing Fuling Electric Power Industrial Co., Ltd., ajuste as previsões e despesas do crescimento e observe instantaneamente como essas mudanças afetam o valor intrínseco de (600452Ss).
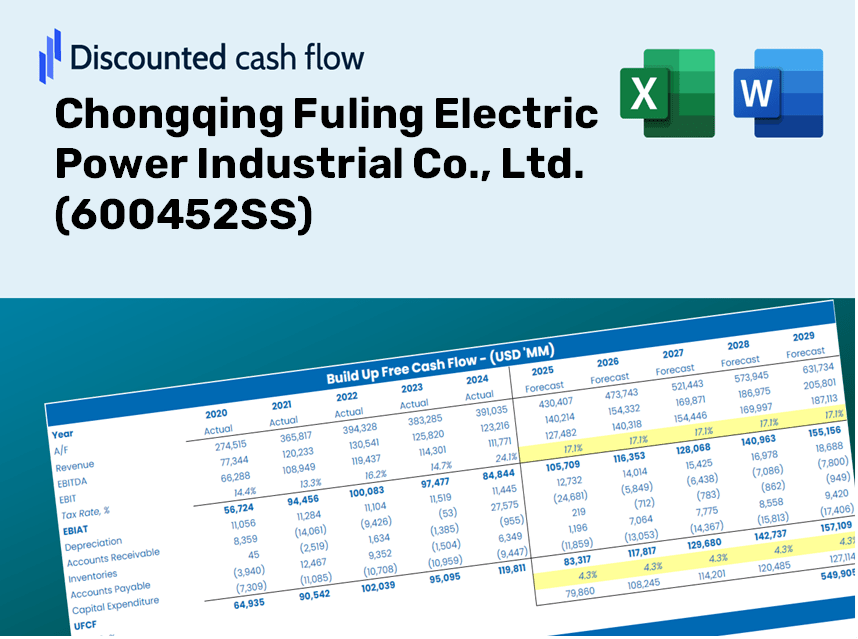
Discounted Cash Flow (DCF) - (USD MM)
| Year | AY1 2020 |
AY2 2021 |
AY3 2022 |
AY4 2023 |
AY5 2024 |
FY1 2025 |
FY2 2026 |
FY3 2027 |
FY4 2028 |
FY5 2029 |
|---|---|---|---|---|---|---|---|---|---|---|
| Revenue | 2,654.4 | 3,145.5 | 3,562.1 | 3,442.3 | 3,116.6 | 3,264.1 | 3,418.5 | 3,580.2 | 3,749.5 | 3,926.9 |
| Revenue Growth, % | 0 | 18.5 | 13.24 | -3.36 | -9.46 | 4.73 | 4.73 | 4.73 | 4.73 | 4.73 |
| EBITDA | 1,246.0 | 1,559.4 | 1,676.5 | 1,574.3 | 1,348.0 | 1,518.2 | 1,590.0 | 1,665.3 | 1,744.0 | 1,826.5 |
| EBITDA, % | 46.94 | 49.58 | 47.06 | 45.73 | 43.25 | 46.51 | 46.51 | 46.51 | 46.51 | 46.51 |
| Depreciation | 810.0 | 1,009.7 | 1,045.0 | 995.4 | 789.4 | 954.4 | 999.5 | 1,046.8 | 1,096.3 | 1,148.2 |
| Depreciation, % | 30.52 | 32.1 | 29.34 | 28.92 | 25.33 | 29.24 | 29.24 | 29.24 | 29.24 | 29.24 |
| EBIT | 435.9 | 549.8 | 631.5 | 579.0 | 558.5 | 563.8 | 590.5 | 618.4 | 647.7 | 678.3 |
| EBIT, % | 16.42 | 17.48 | 17.73 | 16.82 | 17.92 | 17.27 | 17.27 | 17.27 | 17.27 | 17.27 |
| Total Cash | 700.4 | 1,182.9 | 2,212.4 | 2,273.7 | 2,751.4 | 1,830.7 | 1,917.3 | 2,008.0 | 2,103.0 | 2,202.5 |
| Total Cash, percent | .0 | .0 | .0 | .0 | .0 | .0 | .0 | .0 | .0 | .0 |
| Account Receivables | 294.4 | 587.4 | 878.7 | 874.6 | 547.2 | 635.8 | 665.9 | 697.4 | 730.4 | 765.0 |
| Account Receivables, % | 11.09 | 18.68 | 24.67 | 25.41 | 17.56 | 19.48 | 19.48 | 19.48 | 19.48 | 19.48 |
| Inventories | .3 | 1.1 | 1.1 | 1.1 | 1.3 | 1.0 | 1.0 | 1.1 | 1.1 | 1.2 |
| Inventories, % | 0.01167374 | 0.0349351 | 0.0306413 | 0.03189504 | 0.0429508 | 0.0304192 | 0.0304192 | 0.0304192 | 0.0304192 | 0.0304192 |
| Accounts Payable | 1,540.6 | 1,571.9 | 1,817.5 | 1,473.1 | 958.5 | 1,518.3 | 1,590.2 | 1,665.4 | 1,744.2 | 1,826.7 |
| Accounts Payable, % | 58.04 | 49.97 | 51.02 | 42.79 | 30.76 | 46.52 | 46.52 | 46.52 | 46.52 | 46.52 |
| Capital Expenditure | -558.1 | -1,754.3 | -473.8 | -603.5 | -875.2 | -885.9 | -927.8 | -971.7 | -1,017.7 | -1,065.8 |
| Capital Expenditure, % | -21.02 | -55.77 | -13.3 | -17.53 | -28.08 | -27.14 | -27.14 | -27.14 | -27.14 | -27.14 |
| Tax Rate, % | 16.36 | 16.36 | 16.36 | 16.36 | 16.36 | 16.36 | 16.36 | 16.36 | 16.36 | 16.36 |
| EBITAT | 404.9 | 513.8 | 571.3 | 491.3 | 467.2 | 502.2 | 525.9 | 550.8 | 576.9 | 604.1 |
| Depreciation | ||||||||||
| Changes in Account Receivables | ||||||||||
| Changes in Inventories | ||||||||||
| Changes in Accounts Payable | ||||||||||
| Capital Expenditure | ||||||||||
| UFCF | 1,902.8 | -493.4 | 1,096.9 | 542.8 | 194.0 | 1,042.1 | 639.3 | 669.6 | 701.2 | 734.4 |
| WACC, % | 6.01 | 6.01 | 6.01 | 6.01 | 6.01 | 6.01 | 6.01 | 6.01 | 6.01 | 6.01 |
| PV UFCF | ||||||||||
| SUM PV UFCF | 3,217.8 | |||||||||
| Long Term Growth Rate, % | 2.00 | |||||||||
| Free cash flow (T + 1) | 749 | |||||||||
| Terminal Value | 18,689 | |||||||||
| Present Terminal Value | 13,960 | |||||||||
| Enterprise Value | 17,178 | |||||||||
| Net Debt | -2,744 | |||||||||
| Equity Value | 19,922 | |||||||||
| Diluted Shares Outstanding, MM | 1,559 | |||||||||
| Equity Value Per Share | 12.78 |
What You Will Receive
- Authentic 600452SS Financial Data: Pre-filled with Chongqing Fuling Electric Power’s historical and projected figures for accurate analysis.
- Fully Customizable Template: Easily adjust key inputs such as revenue growth, WACC, and EBITDA percentages.
- Instant Calculations: Watch as the intrinsic value for Chongqing Fuling Electric Power updates in real-time with your modifications.
- Professional Valuation Tool: Tailored for investors, analysts, and consultants aiming for reliable DCF outcomes.
- User-Friendly Layout: An intuitive structure and straightforward instructions suitable for all skill levels.
Key Features
- Customizable Forecast Inputs: Adjust essential parameters such as revenue growth, EBITDA %, and capital expenditure.
- Instant DCF Valuation: Quickly computes intrinsic value, NPV, and other relevant financial metrics.
- High-Precision Accuracy: Leverages real financial data from Chongqing Fuling Electric Power Industrial Co., Ltd. for dependable valuation results.
- Effortless Scenario Analysis: Easily explore various assumptions and assess their impacts side-by-side.
- Efficiency-Boosting Solution: Remove the hassle of building intricate valuation models from the ground up.
How It Works
- 1. Download the Template: Obtain and open the Excel file containing preloaded data for Chongqing Fuling Electric Power Industrial Co., Ltd. (600452SS).
- 2. Adjust Key Inputs: Modify essential parameters such as growth rates, WACC, and capital expenditures to fit your analysis.
- 3. Analyze Results in Real-Time: The DCF model automatically calculates intrinsic value and NPV based on your inputs.
- 4. Explore Different Scenarios: Assess multiple forecasts to evaluate various valuation possibilities.
- 5. Present with Assurance: Share professional valuation insights to back your strategic decisions.
Why Opt for Fuling Electric Power Calculator?
- Time Efficiency: Skip the hassle of building a DCF model from the ground up – our calculator is instantly accessible.
- Enhanced Accuracy: Dependable financial data and formulas minimize valuation errors.
- Completely Customizable: Adjust the model to align with your unique assumptions and forecasts.
- User-Friendly: Intuitive charts and outputs simplify result analysis.
- Endorsed by Professionals: Crafted for those who prioritize precision and user experience in financial calculations.
Who Can Benefit from Using This Product?
- Investors: Assess the valuation of Chongqing Fuling Electric Power Industrial Co., Ltd. (600452SS) before making investment decisions.
- CFOs and Financial Analysts: Enhance valuation processes and evaluate financial forecasts.
- Startup Founders: Gain insights into how established companies like Chongqing Fuling are valued within the market.
- Consultants: Create comprehensive valuation reports for clients focused on (600452SS).
- Students and Educators: Utilize current data to practice and teach valuation methodologies relevant to (600452SS).
Contents of the Template
- Comprehensive DCF Model: An editable template featuring detailed valuation calculations tailored for Chongqing Fuling Electric Power Industrial Co., Ltd. (600452SS).
- Real-World Data: Historical and projected financials for Chongqing Fuling Electric Power preloaded for in-depth analysis.
- Customizable Parameters: Modify WACC, growth rates, and tax assumptions to evaluate different scenarios.
- Financial Statements: Complete annual and quarterly breakdowns for enhanced insights.
- Key Ratios: Integrated analysis covering profitability, efficiency, and leverage metrics.
- Dashboard with Visual Outputs: Visualizations including charts and tables for clear, actionable insights.
Disclaimer
All information, articles, and product details provided on this website are for general informational and educational purposes only. We do not claim any ownership over, nor do we intend to infringe upon, any trademarks, copyrights, logos, brand names, or other intellectual property mentioned or depicted on this site. Such intellectual property remains the property of its respective owners, and any references here are made solely for identification or informational purposes, without implying any affiliation, endorsement, or partnership.
We make no representations or warranties, express or implied, regarding the accuracy, completeness, or suitability of any content or products presented. Nothing on this website should be construed as legal, tax, investment, financial, medical, or other professional advice. In addition, no part of this site—including articles or product references—constitutes a solicitation, recommendation, endorsement, advertisement, or offer to buy or sell any securities, franchises, or other financial instruments, particularly in jurisdictions where such activity would be unlawful.
All content is of a general nature and may not address the specific circumstances of any individual or entity. It is not a substitute for professional advice or services. Any actions you take based on the information provided here are strictly at your own risk. You accept full responsibility for any decisions or outcomes arising from your use of this website and agree to release us from any liability in connection with your use of, or reliance upon, the content or products found herein.