
|
Tianjin Benefo Tejing Electric Co., Ltd. (600468.SS) DCF Avaliação |
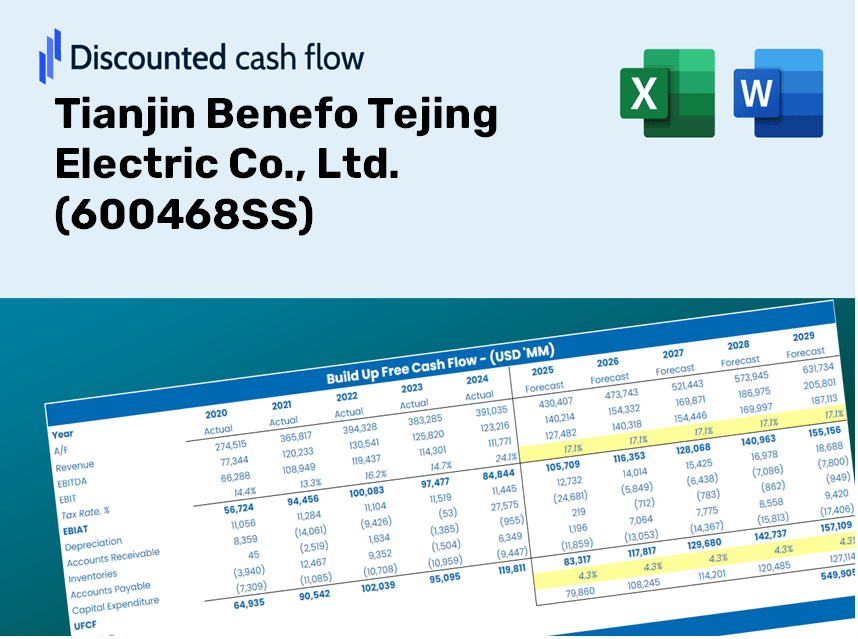
Totalmente Editável: Adapte-Se Às Suas Necessidades No Excel Ou Planilhas
Design Profissional: Modelos Confiáveis E Padrão Da Indústria
Pré-Construídos Para Uso Rápido E Eficiente
Compatível com MAC/PC, totalmente desbloqueado
Não É Necessária Experiência; Fácil De Seguir
Tianjin Benefo Tejing Electric Co., Ltd. (600468.SS) Bundle
Explore as perspectivas financeiras da Tianjin Benefo Tejing Electric Co., Ltd. (600468Ss) com nossa calculadora DCF amigável! Digite suas projeções de crescimento, margens e custos para calcular o valor intrínseco da Tianjin Benefo Tejing Electric Co., Ltd. (600468Ss) e refine sua abordagem de investimento.
Discounted Cash Flow (DCF) - (USD MM)
| Year | AY1 2020 |
AY2 2021 |
AY3 2022 |
AY4 2023 |
AY5 2024 |
FY1 2025 |
FY2 2026 |
FY3 2027 |
FY4 2028 |
FY5 2029 |
|---|---|---|---|---|---|---|---|---|---|---|
| Revenue | 2,199.5 | 2,339.7 | 2,233.0 | 2,035.2 | 1,962.1 | 1,909.9 | 1,859.1 | 1,809.7 | 1,761.6 | 1,714.7 |
| Revenue Growth, % | 0 | 6.38 | -4.56 | -8.86 | -3.6 | -2.66 | -2.66 | -2.66 | -2.66 | -2.66 |
| EBITDA | 212.8 | 207.3 | 184.8 | 186.6 | 145.3 | 165.7 | 161.3 | 157.0 | 152.8 | 148.8 |
| EBITDA, % | 9.67 | 8.86 | 8.28 | 9.17 | 7.4 | 8.68 | 8.68 | 8.68 | 8.68 | 8.68 |
| Depreciation | 63.0 | 63.6 | 59.7 | 58.4 | 57.6 | 53.7 | 52.3 | 50.9 | 49.5 | 48.2 |
| Depreciation, % | 2.86 | 2.72 | 2.68 | 2.87 | 2.93 | 2.81 | 2.81 | 2.81 | 2.81 | 2.81 |
| EBIT | 149.7 | 143.8 | 125.1 | 128.2 | 87.7 | 112.0 | 109.0 | 106.1 | 103.3 | 100.6 |
| EBIT, % | 6.81 | 6.15 | 5.6 | 6.3 | 4.47 | 5.86 | 5.86 | 5.86 | 5.86 | 5.86 |
| Total Cash | 587.8 | 573.3 | 648.1 | 767.6 | 836.9 | 613.5 | 597.2 | 581.3 | 565.9 | 550.8 |
| Total Cash, percent | .0 | .0 | .0 | .0 | .0 | .0 | .0 | .0 | .0 | .0 |
| Account Receivables | 1,135.2 | 1,160.0 | 1,327.0 | 1,348.7 | 1,333.7 | 1,126.3 | 1,096.3 | 1,067.2 | 1,038.8 | 1,011.2 |
| Account Receivables, % | 51.61 | 49.58 | 59.42 | 66.27 | 67.97 | 58.97 | 58.97 | 58.97 | 58.97 | 58.97 |
| Inventories | 582.6 | 581.8 | 451.4 | 475.9 | 460.4 | 452.3 | 440.3 | 428.6 | 417.2 | 406.1 |
| Inventories, % | 26.49 | 24.87 | 20.22 | 23.38 | 23.46 | 23.68 | 23.68 | 23.68 | 23.68 | 23.68 |
| Accounts Payable | 467.2 | 414.9 | 565.3 | 544.3 | 574.3 | 459.5 | 447.3 | 435.4 | 423.8 | 412.6 |
| Accounts Payable, % | 21.24 | 17.73 | 25.32 | 26.74 | 29.27 | 24.06 | 24.06 | 24.06 | 24.06 | 24.06 |
| Capital Expenditure | -32.0 | -74.0 | -80.9 | -41.4 | -59.0 | -50.7 | -49.4 | -48.1 | -46.8 | -45.5 |
| Capital Expenditure, % | -1.45 | -3.16 | -3.62 | -2.03 | -3.01 | -2.66 | -2.66 | -2.66 | -2.66 | -2.66 |
| Tax Rate, % | -26.58 | -26.58 | -26.58 | -26.58 | -26.58 | -26.58 | -26.58 | -26.58 | -26.58 | -26.58 |
| EBITAT | 102.8 | 103.5 | 98.4 | 101.3 | 111.0 | 89.2 | 86.9 | 84.5 | 82.3 | 80.1 |
| Depreciation | ||||||||||
| Changes in Account Receivables | ||||||||||
| Changes in Inventories | ||||||||||
| Changes in Accounts Payable | ||||||||||
| Capital Expenditure | ||||||||||
| UFCF | -1,116.8 | 16.9 | 191.1 | 51.0 | 170.0 | 192.9 | 119.5 | 116.3 | 113.2 | 110.2 |
| WACC, % | 8.75 | 8.76 | 8.77 | 8.77 | 8.81 | 8.77 | 8.77 | 8.77 | 8.77 | 8.77 |
| PV UFCF | ||||||||||
| SUM PV UFCF | 522.0 | |||||||||
| Long Term Growth Rate, % | 3.00 | |||||||||
| Free cash flow (T + 1) | 114 | |||||||||
| Terminal Value | 1,966 | |||||||||
| Present Terminal Value | 1,291 | |||||||||
| Enterprise Value | 1,813 | |||||||||
| Net Debt | -411 | |||||||||
| Equity Value | 2,224 | |||||||||
| Diluted Shares Outstanding, MM | 1,088 | |||||||||
| Equity Value Per Share | 2.04 |
Benefits of Choosing Us
- Comprehensive Financial Model: Leverage Tianjin Benefo Tejing Electric Co., Ltd.'s actual data for accurate DCF valuation.
- Full Control Over Forecasts: Modify revenue growth, profit margins, WACC, and other essential metrics.
- Real-Time Calculations: Instant updates allow you to view results immediately as adjustments are made.
- Professional Template: A polished Excel spreadsheet crafted for high-quality valuation presentations.
- Flexible and Repeatable: Designed for adaptability, facilitating consistent use for thorough forecasting.
Key Features
- Customizable Financial Inputs: Adjust essential metrics such as revenue growth, EBITDA %, and capital expenditures tailored to [600468SS].
- Instant DCF Valuation: Quickly computes intrinsic value, NPV, and additional outputs for [600468SS] with precision.
- High-Precision Analytics: Leverages Tianjin Benefo Tejing Electric's actual financial data to deliver accurate valuation results.
- Streamlined Scenario Analysis: Effortlessly evaluate various assumptions and analyze different outcomes relevant to [600468SS].
- Efficiency Boost: Save time by avoiding the complexities of designing valuation models from the ground up for [600468SS].
How It Works
- Download: Get the ready-to-use Excel file containing financial data for Tianjin Benefo Tejing Electric Co., Ltd. (600468SS).
- Customize: Tailor forecasts by modifying variables like revenue growth, EBITDA %, and WACC.
- Update Automatically: Intrinsic value and NPV calculations refresh in real-time.
- Test Scenarios: Generate multiple projections and instantly compare their outcomes.
- Make Decisions: Leverage the valuation results to inform your investment strategy.
Why Opt for This Calculator?
- Designed for Experts: A sophisticated tool utilized by financial analysts, CFOs, and industry consultants.
- Accurate Data: Preloaded financial information for Tianjin Benefo Tejing Electric Co., Ltd. (600468SS) to ensure precision.
- Flexible Scenario Analysis: Effortlessly test various projections and assumptions.
- Clear Results: Instantly computes intrinsic value, NPV, and essential financial metrics.
- User-Friendly: Step-by-step guidance helps you navigate the calculations with ease.
Who Can Benefit from This Product?
- Investors: Assess the fair value of Tianjin Benefo Tejing Electric Co., Ltd. (600468SS) to make informed investment choices.
- CFOs: Utilize a high-quality DCF model for precise financial reporting and analysis.
- Consultants: Efficiently customize the template for client valuation reports.
- Entrepreneurs: Explore financial modeling techniques used by leading companies to enhance business strategies.
- Educators: Employ it as a resource to illustrate valuation methods in the classroom.
Contents of the Template
- Detailed DCF Model: An editable template featuring in-depth valuation calculations.
- Real-World Data: Historical and projected financial information for Tianjin Benefo Tejing Electric Co., Ltd. (600468SS) preloaded for your analysis.
- Customizable Assumptions: Modify WACC, growth rates, and tax parameters to explore different scenarios.
- Financial Statements: Comprehensive annual and quarterly financial breakdowns for enhanced insights.
- Essential Ratios: Integrated analysis for evaluating profitability, efficiency, and leverage.
- Dashboard with Visual Outputs: Graphs and tables that present clear, actionable insights.
Disclaimer
All information, articles, and product details provided on this website are for general informational and educational purposes only. We do not claim any ownership over, nor do we intend to infringe upon, any trademarks, copyrights, logos, brand names, or other intellectual property mentioned or depicted on this site. Such intellectual property remains the property of its respective owners, and any references here are made solely for identification or informational purposes, without implying any affiliation, endorsement, or partnership.
We make no representations or warranties, express or implied, regarding the accuracy, completeness, or suitability of any content or products presented. Nothing on this website should be construed as legal, tax, investment, financial, medical, or other professional advice. In addition, no part of this site—including articles or product references—constitutes a solicitation, recommendation, endorsement, advertisement, or offer to buy or sell any securities, franchises, or other financial instruments, particularly in jurisdictions where such activity would be unlawful.
All content is of a general nature and may not address the specific circumstances of any individual or entity. It is not a substitute for professional advice or services. Any actions you take based on the information provided here are strictly at your own risk. You accept full responsibility for any decisions or outcomes arising from your use of this website and agree to release us from any liability in connection with your use of, or reliance upon, the content or products found herein.