
|
China Shipbuilding Industry Group Power Co., Ltd. (600482.SS) Avaliação DCF |
Totalmente Editável: Adapte-Se Às Suas Necessidades No Excel Ou Planilhas
Design Profissional: Modelos Confiáveis E Padrão Da Indústria
Pré-Construídos Para Uso Rápido E Eficiente
Compatível com MAC/PC, totalmente desbloqueado
Não É Necessária Experiência; Fácil De Seguir
China Shipbuilding Industry Group Power Co., Ltd. (600482.SS) Bundle
Explore as perspectivas financeiras do Grupo da Indústria de Construção Naval da China, Power Co., Ltd. (600482Ss) com nossa calculadora DCF amigável! Digite suas projeções de crescimento, margens e despesas para determinar o valor intrínseco do grupo da indústria de construção naval da China Power Co., Ltd. (600482Ss) e molde sua abordagem de investimento.
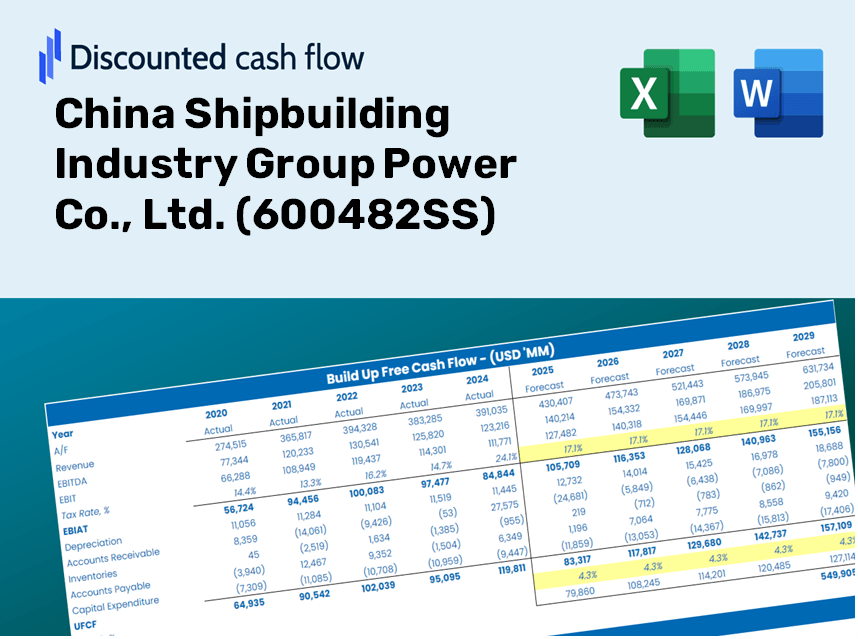
Discounted Cash Flow (DCF) - (USD MM)
| Year | AY1 2020 |
AY2 2021 |
AY3 2022 |
AY4 2023 |
AY5 2024 |
FY1 2025 |
FY2 2026 |
FY3 2027 |
FY4 2028 |
FY5 2029 |
|---|---|---|---|---|---|---|---|---|---|---|
| Revenue | 27,014.2 | 34,668.7 | 38,280.1 | 45,102.8 | 51,696.6 | 60,897.9 | 71,736.9 | 84,505.2 | 99,545.9 | 117,263.8 |
| Revenue Growth, % | 0 | 28.34 | 10.42 | 17.82 | 14.62 | 17.8 | 17.8 | 17.8 | 17.8 | 17.8 |
| EBITDA | 1,005.6 | 1,345.2 | 1,297.5 | 1,805.5 | 3,453.2 | 2,639.9 | 3,109.8 | 3,663.3 | 4,315.3 | 5,083.4 |
| EBITDA, % | 3.72 | 3.88 | 3.39 | 4 | 6.68 | 4.34 | 4.34 | 4.34 | 4.34 | 4.34 |
| Depreciation | 800.9 | 1,134.4 | 1,250.2 | 1,274.2 | 1,359.3 | 1,821.7 | 2,146.0 | 2,527.9 | 2,977.9 | 3,507.9 |
| Depreciation, % | 2.96 | 3.27 | 3.27 | 2.82 | 2.63 | 2.99 | 2.99 | 2.99 | 2.99 | 2.99 |
| EBIT | 204.6 | 210.8 | 47.3 | 531.4 | 2,093.9 | 818.2 | 963.8 | 1,135.4 | 1,337.5 | 1,575.5 |
| EBIT, % | 0.75752 | 0.60803 | 0.12365 | 1.18 | 4.05 | 1.34 | 1.34 | 1.34 | 1.34 | 1.34 |
| Total Cash | 10,579.2 | 13,069.5 | 21,976.0 | 27,155.5 | 37,754.5 | 32,581.2 | 38,380.3 | 45,211.4 | 53,258.5 | 62,737.8 |
| Total Cash, percent | .0 | .0 | .0 | .0 | .0 | .0 | .0 | .0 | .0 | .0 |
| Account Receivables | 17,319.6 | 17,715.8 | 18,992.0 | 21,345.8 | 21,148.0 | 30,821.8 | 36,307.7 | 42,770.0 | 50,382.5 | 59,349.9 |
| Account Receivables, % | 64.11 | 51.1 | 49.61 | 47.33 | 40.91 | 50.61 | 50.61 | 50.61 | 50.61 | 50.61 |
| Inventories | 10,110.5 | 11,470.0 | 15,401.5 | 17,855.0 | 17,599.3 | 22,456.2 | 26,453.1 | 31,161.4 | 36,707.7 | 43,241.1 |
| Inventories, % | 37.43 | 33.08 | 40.23 | 39.59 | 34.04 | 36.88 | 36.88 | 36.88 | 36.88 | 36.88 |
| Accounts Payable | 9,585.6 | 11,638.3 | 14,194.1 | 17,094.7 | 18,849.6 | 21,983.8 | 25,896.6 | 30,505.8 | 35,935.5 | 42,331.5 |
| Accounts Payable, % | 35.48 | 33.57 | 37.08 | 37.9 | 36.46 | 36.1 | 36.1 | 36.1 | 36.1 | 36.1 |
| Capital Expenditure | -1,214.2 | -1,152.7 | -1,287.0 | -924.3 | -1,086.5 | -1,867.5 | -2,199.8 | -2,591.4 | -3,052.6 | -3,595.9 |
| Capital Expenditure, % | -4.49 | -3.32 | -3.36 | -2.05 | -2.1 | -3.07 | -3.07 | -3.07 | -3.07 | -3.07 |
| Tax Rate, % | 50.86 | 50.86 | 50.86 | 50.86 | 50.86 | 50.86 | 50.86 | 50.86 | 50.86 | 50.86 |
| EBITAT | 167.6 | 169.8 | 33.9 | 356.9 | 1,028.9 | 573.3 | 675.4 | 795.6 | 937.2 | 1,104.0 |
| Depreciation | ||||||||||
| Changes in Account Receivables | ||||||||||
| Changes in Inventories | ||||||||||
| Changes in Accounts Payable | ||||||||||
| Capital Expenditure | ||||||||||
| UFCF | -18,090.2 | 448.5 | -2,654.7 | -1,200.1 | 3,510.2 | -10,869.0 | -4,948.5 | -5,829.2 | -6,866.7 | -8,088.9 |
| WACC, % | 6.6 | 6.59 | 6.55 | 6.53 | 6.45 | 6.55 | 6.55 | 6.55 | 6.55 | 6.55 |
| PV UFCF | ||||||||||
| SUM PV UFCF | -30,598.7 | |||||||||
| Long Term Growth Rate, % | 3.00 | |||||||||
| Free cash flow (T + 1) | -8,332 | |||||||||
| Terminal Value | -234,891 | |||||||||
| Present Terminal Value | -171,065 | |||||||||
| Enterprise Value | -201,663 | |||||||||
| Net Debt | -31,720 | |||||||||
| Equity Value | -169,943 | |||||||||
| Diluted Shares Outstanding, MM | 2,280 | |||||||||
| Equity Value Per Share | -74.53 |
What You'll Receive
- Genuine CSIC Financial Data: Offers historical and projected figures for precise valuation.
- Customizable Parameters: Adjust WACC, tax rates, revenue growth, and investment in capital.
- Automatic Calculations: Intrinsic value and NPV are computed in real-time.
- Scenario Testing: Evaluate various scenarios to assess the future performance of China Shipbuilding Industry Group Power Co., Ltd. (600482SS).
- User-Friendly Interface: Designed for industry experts, yet easy to navigate for newcomers.
Highlighted Features
- Authentic Financial Data: Access reliable historical figures and future forecasts for China Shipbuilding Industry Group Power Co., Ltd. (600482SS).
- Adjustable Forecast Inputs: Modify highlighted cells such as WACC, growth rates, and profit margins.
- Real-time Calculations: Instantly refresh DCF, Net Present Value (NPV), and cash flow assessments.
- User-Friendly Dashboard: Intuitive charts and summaries to help you interpret your valuation findings.
- Designed for All Levels: An accessible layout tailored for investors, CFOs, and consultants alike.
How It Works
- Download: Obtain the ready-to-use Excel template featuring financial data for China Shipbuilding Industry Group Power Co., Ltd. (600482SS).
- Customize: Modify forecasts, such as revenue growth, EBITDA %, and WACC as needed.
- Update Automatically: Intrinsic value and NPV calculations refresh in real-time.
- Test Scenarios: Develop various projections and analyze the results without delay.
- Make Decisions: Utilize the valuation findings to inform your investment choices.
Why Choose This Calculator for China Shipbuilding Industry Group Power Co., Ltd. (600482SS)?
- Time-Saving: Skip the hassle of building a DCF model from scratch – it’s ready for immediate use.
- Enhanced Accuracy: Dependable financial data and formulas minimize valuation errors.
- Completely Customizable: Adjust the model to incorporate your specific assumptions and forecasts.
- User-Friendly: Intuitive charts and outputs ensure the results are easy to understand.
- Endorsed by Professionals: Tailored for experts who prioritize precision and practicality.
Who Should Utilize This Product?
- Individual Investors: Gain insights for informed trading decisions on China Shipbuilding Industry Group Power Co., Ltd. (600482SS).
- Financial Analysts: Enhance your valuation efforts with comprehensive financial models tailored for (600482SS).
- Consultants: Provide clients with accurate and timely valuation assessments for (600482SS).
- Business Owners: Learn from the valuation metrics of large firms like China Shipbuilding to refine your own business strategies.
- Finance Students: Acquire practical valuation skills through analysis of (600482SS) and other real-world cases.
Contents of the Template
- Historical Data: Provides past financial performance and baseline forecasts for China Shipbuilding Industry Group Power Co., Ltd. (600482SS).
- DCF and Levered DCF Models: Comprehensive templates for assessing the intrinsic value of China Shipbuilding Industry Group Power Co., Ltd. (600482SS).
- WACC Sheet: Pre-configured calculations for the Weighted Average Cost of Capital.
- Editable Inputs: Adjust key drivers such as growth rates, EBITDA percentages, and CAPEX assumptions.
- Quarterly and Annual Statements: A thorough overview of the financial statements for China Shipbuilding Industry Group Power Co., Ltd. (600482SS).
- Interactive Dashboard: Visualize valuation outcomes and projections in an engaging manner.
Disclaimer
All information, articles, and product details provided on this website are for general informational and educational purposes only. We do not claim any ownership over, nor do we intend to infringe upon, any trademarks, copyrights, logos, brand names, or other intellectual property mentioned or depicted on this site. Such intellectual property remains the property of its respective owners, and any references here are made solely for identification or informational purposes, without implying any affiliation, endorsement, or partnership.
We make no representations or warranties, express or implied, regarding the accuracy, completeness, or suitability of any content or products presented. Nothing on this website should be construed as legal, tax, investment, financial, medical, or other professional advice. In addition, no part of this site—including articles or product references—constitutes a solicitation, recommendation, endorsement, advertisement, or offer to buy or sell any securities, franchises, or other financial instruments, particularly in jurisdictions where such activity would be unlawful.
All content is of a general nature and may not address the specific circumstances of any individual or entity. It is not a substitute for professional advice or services. Any actions you take based on the information provided here are strictly at your own risk. You accept full responsibility for any decisions or outcomes arising from your use of this website and agree to release us from any liability in connection with your use of, or reliance upon, the content or products found herein.