
|
Shanghai Datun Energy Resources Co., Ltd. (600508.SS) Avaliação DCF |
Totalmente Editável: Adapte-Se Às Suas Necessidades No Excel Ou Planilhas
Design Profissional: Modelos Confiáveis E Padrão Da Indústria
Pré-Construídos Para Uso Rápido E Eficiente
Compatível com MAC/PC, totalmente desbloqueado
Não É Necessária Experiência; Fácil De Seguir
Shanghai Datun Energy Resources Co., Ltd. (600508.SS) Bundle
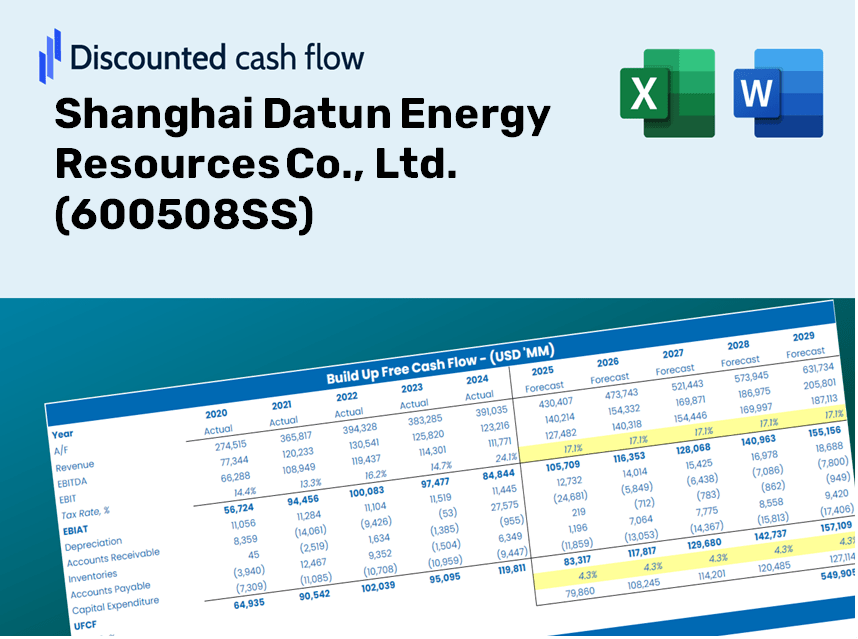
Obtenha informações sobre sua análise de avaliação de Shanghai Datun Energy Resources Co., Ltd. (600508Ss) usando nossa calculadora de ponta DCF! Apresentando dados reais (600508Ss), este modelo do Excel permite ajustar as previsões e suposições para determinar com precisão o valor intrínseco da Shanghai Datun Energy Resources Co., Ltd.
Discounted Cash Flow (DCF) - (USD MM)
| Year | AY1 2020 |
AY2 2021 |
AY3 2022 |
AY4 2023 |
AY5 2024 |
FY1 2025 |
FY2 2026 |
FY3 2027 |
FY4 2028 |
FY5 2029 |
|---|---|---|---|---|---|---|---|---|---|---|
| Revenue | 7,654.1 | 10,156.5 | 12,633.9 | 10,977.7 | 9,488.2 | 9,371.7 | 9,256.7 | 9,143.0 | 9,030.7 | 8,919.8 |
| Revenue Growth, % | 0 | 32.69 | 24.39 | -13.11 | -13.57 | -1.23 | -1.23 | -1.23 | -1.23 | -1.23 |
| EBITDA | 1,642.1 | 2,036.3 | 3,760.0 | 2,267.7 | 1,858.8 | 2,090.1 | 2,064.5 | 2,039.1 | 2,014.1 | 1,989.3 |
| EBITDA, % | 21.45 | 20.05 | 29.76 | 20.66 | 19.59 | 22.3 | 22.3 | 22.3 | 22.3 | 22.3 |
| Depreciation | 759.1 | 890.3 | 895.7 | 860.9 | 922.9 | 812.4 | 802.4 | 792.6 | 782.8 | 773.2 |
| Depreciation, % | 9.92 | 8.77 | 7.09 | 7.84 | 9.73 | 8.67 | 8.67 | 8.67 | 8.67 | 8.67 |
| EBIT | 883.0 | 1,146.0 | 2,864.3 | 1,406.7 | 936.0 | 1,277.7 | 1,262.1 | 1,246.6 | 1,231.2 | 1,216.1 |
| EBIT, % | 11.54 | 11.28 | 22.67 | 12.81 | 9.86 | 13.63 | 13.63 | 13.63 | 13.63 | 13.63 |
| Total Cash | 597.3 | 1,021.3 | 3,186.0 | 3,161.6 | 2,704.5 | 1,881.5 | 1,858.4 | 1,835.6 | 1,813.0 | 1,790.8 |
| Total Cash, percent | .0 | .0 | .0 | .0 | .0 | .0 | .0 | .0 | .0 | .0 |
| Account Receivables | 1,122.5 | 1,431.6 | 1,148.8 | 591.6 | 791.9 | 967.0 | 955.1 | 943.4 | 931.8 | 920.3 |
| Account Receivables, % | 14.67 | 14.1 | 9.09 | 5.39 | 8.35 | 10.32 | 10.32 | 10.32 | 10.32 | 10.32 |
| Inventories | 323.8 | 279.4 | 450.2 | 289.7 | 254.3 | 297.3 | 293.7 | 290.1 | 286.5 | 283.0 |
| Inventories, % | 4.23 | 2.75 | 3.56 | 2.64 | 2.68 | 3.17 | 3.17 | 3.17 | 3.17 | 3.17 |
| Accounts Payable | 1,800.0 | 1,560.5 | 1,282.9 | 1,302.8 | 1,171.1 | 1,372.9 | 1,356.0 | 1,339.4 | 1,322.9 | 1,306.7 |
| Accounts Payable, % | 23.52 | 15.37 | 10.15 | 11.87 | 12.34 | 14.65 | 14.65 | 14.65 | 14.65 | 14.65 |
| Capital Expenditure | -688.0 | -942.1 | -1,000.7 | -1,133.4 | -1,220.2 | -925.4 | -914.0 | -902.8 | -891.7 | -880.7 |
| Capital Expenditure, % | -8.99 | -9.28 | -7.92 | -10.32 | -12.86 | -9.87 | -9.87 | -9.87 | -9.87 | -9.87 |
| Tax Rate, % | 18.72 | 18.72 | 18.72 | 18.72 | 18.72 | 18.72 | 18.72 | 18.72 | 18.72 | 18.72 |
| EBITAT | 731.0 | 803.4 | 2,116.3 | 1,008.2 | 760.8 | 970.4 | 958.5 | 946.7 | 935.1 | 923.6 |
| Depreciation | ||||||||||
| Changes in Account Receivables | ||||||||||
| Changes in Inventories | ||||||||||
| Changes in Accounts Payable | ||||||||||
| Capital Expenditure | ||||||||||
| UFCF | 1,155.7 | 247.4 | 1,845.8 | 1,473.3 | 166.8 | 841.1 | 845.6 | 835.2 | 824.9 | 814.8 |
| WACC, % | 4.64 | 4.52 | 4.56 | 4.54 | 4.63 | 4.58 | 4.58 | 4.58 | 4.58 | 4.58 |
| PV UFCF | ||||||||||
| SUM PV UFCF | 3,648.9 | |||||||||
| Long Term Growth Rate, % | 0.50 | |||||||||
| Free cash flow (T + 1) | 819 | |||||||||
| Terminal Value | 20,087 | |||||||||
| Present Terminal Value | 16,060 | |||||||||
| Enterprise Value | 19,709 | |||||||||
| Net Debt | -733 | |||||||||
| Equity Value | 20,442 | |||||||||
| Diluted Shares Outstanding, MM | 723 | |||||||||
| Equity Value Per Share | 28.29 |
Benefits You Will Receive
- Authentic 600508SS Financial Data: Pre-loaded with Shanghai Datun Energy Resources' historical and projected figures for accurate analysis.
- Fully Customizable Template: Easily adjust key metrics such as revenue growth, WACC, and EBITDA percentages.
- Instant Calculations: Watch the intrinsic value of Shanghai Datun Energy Resources update in real-time as you make changes.
- Professional Valuation Tool: Tailored for investors, analysts, and consultants aiming for precise DCF results.
- User-Centric Design: Intuitive layout and clear guidelines suitable for users of all skill levels.
Core Features
- Pre-Loaded Data: Historical financial statements and pre-filled forecasts for Shanghai Datun Energy Resources Co., Ltd. (600508SS).
- Fully Customizable Inputs: Adjust WACC, tax rates, revenue growth, and EBITDA margins to suit your analysis.
- Real-Time Results: Observe the recalculation of the intrinsic value for Shanghai Datun Energy Resources Co., Ltd. (600508SS) instantly.
- Clear Visual Outputs: Intuitive dashboard charts present valuation results and critical metrics effectively.
- Designed for Precision: A professional-grade tool tailored for analysts, investors, and finance professionals.
How It Functions
- Download: Obtain the pre-built Excel file containing Shanghai Datun Energy Resources Co., Ltd.'s (600508SS) financial information.
- Customize: Modify forecasts such as revenue growth, EBITDA percentage, and WACC as needed.
- Update Automatically: The intrinsic value and NPV calculations refresh in real-time.
- Test Scenarios: Generate various projections and analyze results immediately.
- Make Decisions: Leverage the valuation insights to inform your investment strategy.
Why Select This Calculator for Shanghai Datun Energy Resources Co., Ltd. (600508SS)?
- All-in-One Solution: Integrates DCF, WACC, and various financial ratio analyses seamlessly.
- Adjustable Parameters: Modify the highlighted cells to explore different financial scenarios.
- In-Depth Analysis: Automatically computes the intrinsic value and Net Present Value for Shanghai Datun Energy Resources.
- Preloaded Information: Comes with historical and projected data for precise calculations.
- High-Caliber Tool: Perfect for financial analysts, investors, and business consultants focused on (600508SS).
Who Can Benefit from This Product?
- Investors: Make informed investment choices by accurately assessing the fair value of Shanghai Datun Energy Resources Co., Ltd. (600508SS).
- CFOs: Utilize a high-caliber DCF model for effective financial reporting and analysis.
- Consultants: Easily customize the template for client valuation reports.
- Entrepreneurs: Acquire valuable insights into financial modeling techniques employed by leading corporations.
- Educators: Incorporate this tool as a resource for teaching valuation methodologies.
What the Template Contains
- Pre-Filled DCF Model: Shanghai Datun Energy Resources Co., Ltd.’s (600508SS) financial data preloaded for immediate use.
- WACC Calculator: Comprehensive calculations for Weighted Average Cost of Capital.
- Financial Ratios: Assess Shanghai Datun's profitability, leverage, and efficiency metrics.
- Editable Inputs: Modify assumptions like growth rates, profit margins, and CAPEX to align with your scenarios.
- Financial Statements: Access annual and quarterly reports for thorough analysis.
- Interactive Dashboard: Effortlessly visualize key valuation metrics and outcomes.
Disclaimer
All information, articles, and product details provided on this website are for general informational and educational purposes only. We do not claim any ownership over, nor do we intend to infringe upon, any trademarks, copyrights, logos, brand names, or other intellectual property mentioned or depicted on this site. Such intellectual property remains the property of its respective owners, and any references here are made solely for identification or informational purposes, without implying any affiliation, endorsement, or partnership.
We make no representations or warranties, express or implied, regarding the accuracy, completeness, or suitability of any content or products presented. Nothing on this website should be construed as legal, tax, investment, financial, medical, or other professional advice. In addition, no part of this site—including articles or product references—constitutes a solicitation, recommendation, endorsement, advertisement, or offer to buy or sell any securities, franchises, or other financial instruments, particularly in jurisdictions where such activity would be unlawful.
All content is of a general nature and may not address the specific circumstances of any individual or entity. It is not a substitute for professional advice or services. Any actions you take based on the information provided here are strictly at your own risk. You accept full responsibility for any decisions or outcomes arising from your use of this website and agree to release us from any liability in connection with your use of, or reliance upon, the content or products found herein.