
|
Xinjiang Tianfu Energy Co., Ltd. (600509.SS) Avaliação DCF |
Totalmente Editável: Adapte-Se Às Suas Necessidades No Excel Ou Planilhas
Design Profissional: Modelos Confiáveis E Padrão Da Indústria
Pré-Construídos Para Uso Rápido E Eficiente
Compatível com MAC/PC, totalmente desbloqueado
Não É Necessária Experiência; Fácil De Seguir
Xinjiang Tianfu Energy Co., Ltd. (600509.SS) Bundle
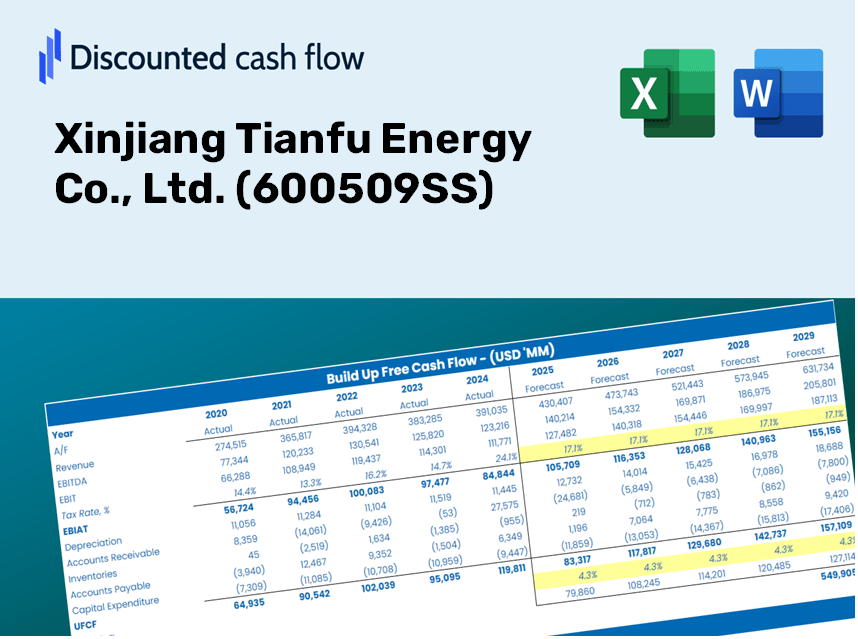
Obtenha informações sobre a análise de avaliação da Xinjiang Tianfu Energy Co., Ltd. (600509SS) usando nossa poderosa calculadora DCF! Este modelo do Excel é pré -carregado com dados reais (600509Ss), permitindo ajustar as previsões e suposições para um cálculo preciso do valor intrínseco da Xinjiang Tianfu Energy Co., Ltd.
Discounted Cash Flow (DCF) - (USD MM)
| Year | AY1 2020 |
AY2 2021 |
AY3 2022 |
AY4 2023 |
AY5 2024 |
FY1 2025 |
FY2 2026 |
FY3 2027 |
FY4 2028 |
FY5 2029 |
|---|---|---|---|---|---|---|---|---|---|---|
| Revenue | 4,895.8 | 7,065.1 | 8,142.6 | 9,507.8 | 9,270.8 | 10,982.1 | 13,009.2 | 15,410.5 | 18,255.1 | 21,624.7 |
| Revenue Growth, % | 0 | 44.31 | 15.25 | 16.77 | -2.49 | 18.46 | 18.46 | 18.46 | 18.46 | 18.46 |
| EBITDA | 1,686.8 | 1,491.0 | 1,413.2 | 2,063.5 | 1,981.6 | 2,547.7 | 3,017.9 | 3,575.0 | 4,234.9 | 5,016.6 |
| EBITDA, % | 34.45 | 21.1 | 17.36 | 21.7 | 21.37 | 23.2 | 23.2 | 23.2 | 23.2 | 23.2 |
| Depreciation | 1,074.9 | 1,129.6 | 1,146.5 | 1,142.3 | 1,262.1 | 1,705.6 | 2,020.4 | 2,393.4 | 2,835.2 | 3,358.5 |
| Depreciation, % | 21.96 | 15.99 | 14.08 | 12.01 | 13.61 | 15.53 | 15.53 | 15.53 | 15.53 | 15.53 |
| EBIT | 611.9 | 361.4 | 266.7 | 921.2 | 719.5 | 842.0 | 997.5 | 1,181.6 | 1,399.7 | 1,658.1 |
| EBIT, % | 12.5 | 5.12 | 3.28 | 9.69 | 7.76 | 7.67 | 7.67 | 7.67 | 7.67 | 7.67 |
| Total Cash | 2,046.0 | 1,657.2 | 1,745.3 | 1,624.0 | 2,180.5 | 2,795.7 | 3,311.7 | 3,923.0 | 4,647.1 | 5,504.9 |
| Total Cash, percent | .0 | .0 | .0 | .0 | .0 | .0 | .0 | .0 | .0 | .0 |
| Account Receivables | 1,787.2 | 1,707.3 | 2,650.8 | 2,948.4 | 3,511.1 | 3,560.6 | 4,217.8 | 4,996.4 | 5,918.6 | 7,011.1 |
| Account Receivables, % | 36.51 | 24.17 | 32.55 | 31.01 | 37.87 | 32.42 | 32.42 | 32.42 | 32.42 | 32.42 |
| Inventories | 364.3 | 547.5 | 285.9 | 466.0 | 467.4 | 629.1 | 745.3 | 882.8 | 1,045.8 | 1,238.8 |
| Inventories, % | 7.44 | 7.75 | 3.51 | 4.9 | 5.04 | 5.73 | 5.73 | 5.73 | 5.73 | 5.73 |
| Accounts Payable | 1,270.7 | 501.3 | 1,655.5 | 2,090.7 | 3,256.5 | 2,426.9 | 2,874.9 | 3,405.6 | 4,034.2 | 4,778.9 |
| Accounts Payable, % | 25.95 | 7.1 | 20.33 | 21.99 | 35.13 | 22.1 | 22.1 | 22.1 | 22.1 | 22.1 |
| Capital Expenditure | -407.9 | -377.4 | -500.6 | -1,901.4 | -4,725.8 | -1,994.2 | -2,362.3 | -2,798.3 | -3,314.9 | -3,926.8 |
| Capital Expenditure, % | -8.33 | -5.34 | -6.15 | -20 | -50.98 | -18.16 | -18.16 | -18.16 | -18.16 | -18.16 |
| Tax Rate, % | 15.06 | 15.06 | 15.06 | 15.06 | 15.06 | 15.06 | 15.06 | 15.06 | 15.06 | 15.06 |
| EBITAT | 218.1 | 220.1 | 200.8 | 835.0 | 611.1 | 585.1 | 693.1 | 821.0 | 972.5 | 1,152.1 |
| Depreciation | ||||||||||
| Changes in Account Receivables | ||||||||||
| Changes in Inventories | ||||||||||
| Changes in Accounts Payable | ||||||||||
| Capital Expenditure | ||||||||||
| UFCF | 4.3 | 99.6 | 1,319.1 | 33.5 | -2,251.0 | -744.2 | 25.8 | 30.6 | 36.2 | 42.9 |
| WACC, % | 3.96 | 4.41 | 4.67 | 4.95 | 4.85 | 4.57 | 4.57 | 4.57 | 4.57 | 4.57 |
| PV UFCF | ||||||||||
| SUM PV UFCF | -596.7 | |||||||||
| Long Term Growth Rate, % | 2.00 | |||||||||
| Free cash flow (T + 1) | 44 | |||||||||
| Terminal Value | 1,705 | |||||||||
| Present Terminal Value | 1,364 | |||||||||
| Enterprise Value | 767 | |||||||||
| Net Debt | 9,416 | |||||||||
| Equity Value | -8,649 | |||||||||
| Diluted Shares Outstanding, MM | 1,376 | |||||||||
| Equity Value Per Share | -6.28 |
What You Will Receive
- Flexible Input Assumptions: Effortlessly adjust key parameters (growth %, margins, WACC) to explore various scenarios.
- Comprehensive Data: Financial information for Xinjiang Tianfu Energy Co., Ltd. (600509SS) pre-populated to facilitate your analysis.
- Automated DCF Calculations: The template swiftly computes Net Present Value (NPV) and intrinsic value on your behalf.
- Customizable and Professional Design: A refined Excel model tailored to meet your valuation requirements.
- Designed for Analysts and Investors: Perfect for evaluating projections, confirming strategies, and enhancing efficiency.
Key Features
- Customizable Forecast Inputs: Adjust vital parameters such as revenue growth, EBITDA %, and capital expenditures.
- Instant DCF Valuation: Automatically computes intrinsic value, NPV, and various financial metrics.
- High-Precision Accuracy: Leverages Xinjiang Tianfu Energy’s actual financial data for dependable valuation results.
- Effortless Scenario Analysis: Easily evaluate different assumptions and analyze comparative outcomes.
- Efficiency Booster: Streamline your workflow by avoiding the need to create intricate valuation models from scratch.
How It Functions
- Step 1: Download the preconfigured Excel template containing data for Xinjiang Tianfu Energy Co., Ltd. (600509SS).
- Step 2: Review the pre-populated sheets to familiarize yourself with the essential metrics.
- Step 3: Modify forecasts and assumptions in the editable yellow cells (WACC, growth, margins).
- Step 4: Instantly observe the updated results, including the intrinsic value of Xinjiang Tianfu Energy Co., Ltd. (600509SS).
- Step 5: Utilize the outputs to make well-informed investment decisions or to create detailed reports.
Why Choose This Calculator for Xinjiang Tianfu Energy Co., Ltd. (600509SS)?
- Reliable Data: Up-to-date financial information from Xinjiang Tianfu Energy ensures trustworthy valuation outcomes.
- Adaptable: Modify essential inputs such as growth projections, WACC, and tax rates to align with your financial forecasts.
- Efficiency: Pre-configured calculations save you time and effort, allowing you to focus on analysis.
- Professional Quality: Tailored for investors, financial analysts, and consultants working with Xinjiang Tianfu Energy.
- Easy to Use: User-friendly design and clear instructions simplify the process for everyone.
Who Can Benefit from This Product?
- Investors: Evaluate Xinjiang Tianfu Energy Co., Ltd.'s (600509SS) financial standing before making stock transactions.
- CFOs and Financial Analysts: Enhance valuation methodologies and validate financial forecasts.
- Startup Founders: Understand the valuation strategies of established firms like Xinjiang Tianfu Energy Co., Ltd. (600509SS).
- Consultants: Provide clients with comprehensive and accurate valuation assessments.
- Students and Educators: Access real data to practice and teach valuation principles using Xinjiang Tianfu Energy Co., Ltd. (600509SS) as a case study.
Contents of the Template
- Pre-Filled Data: Features historical financials and forecasts for Xinjiang Tianfu Energy Co., Ltd. (600509SS).
- Discounted Cash Flow Model: An editable DCF valuation model with automated calculations.
- Weighted Average Cost of Capital (WACC): A dedicated worksheet for WACC calculations based on user-defined inputs.
- Key Financial Ratios: Evaluate Xinjiang Tianfu Energy’s profitability, efficiency, and leverage metrics.
- Customizable Inputs: Easily adjust revenue growth rates, profit margins, and tax rates.
- Clear Dashboard: Visual summaries of key valuation results through charts and tables.
Disclaimer
All information, articles, and product details provided on this website are for general informational and educational purposes only. We do not claim any ownership over, nor do we intend to infringe upon, any trademarks, copyrights, logos, brand names, or other intellectual property mentioned or depicted on this site. Such intellectual property remains the property of its respective owners, and any references here are made solely for identification or informational purposes, without implying any affiliation, endorsement, or partnership.
We make no representations or warranties, express or implied, regarding the accuracy, completeness, or suitability of any content or products presented. Nothing on this website should be construed as legal, tax, investment, financial, medical, or other professional advice. In addition, no part of this site—including articles or product references—constitutes a solicitation, recommendation, endorsement, advertisement, or offer to buy or sell any securities, franchises, or other financial instruments, particularly in jurisdictions where such activity would be unlawful.
All content is of a general nature and may not address the specific circumstances of any individual or entity. It is not a substitute for professional advice or services. Any actions you take based on the information provided here are strictly at your own risk. You accept full responsibility for any decisions or outcomes arising from your use of this website and agree to release us from any liability in connection with your use of, or reliance upon, the content or products found herein.