
|
China National Medicines Corporation Ltd. (600511.SS) Avaliação DCF |
Totalmente Editável: Adapte-Se Às Suas Necessidades No Excel Ou Planilhas
Design Profissional: Modelos Confiáveis E Padrão Da Indústria
Pré-Construídos Para Uso Rápido E Eficiente
Compatível com MAC/PC, totalmente desbloqueado
Não É Necessária Experiência; Fácil De Seguir
China National Medicines Corporation Ltd. (600511.SS) Bundle
Descubra o verdadeiro valor da China National Medicines Corporation Ltd. (600511SS) com nossa calculadora avançada de DCF! Personalize as principais suposições, explore vários cenários e avalie os efeitos das mudanças na avaliação da China National Medicines Corporation Ltd. (600511Ss) - tudo dentro de um modelo conveniente do Excel.
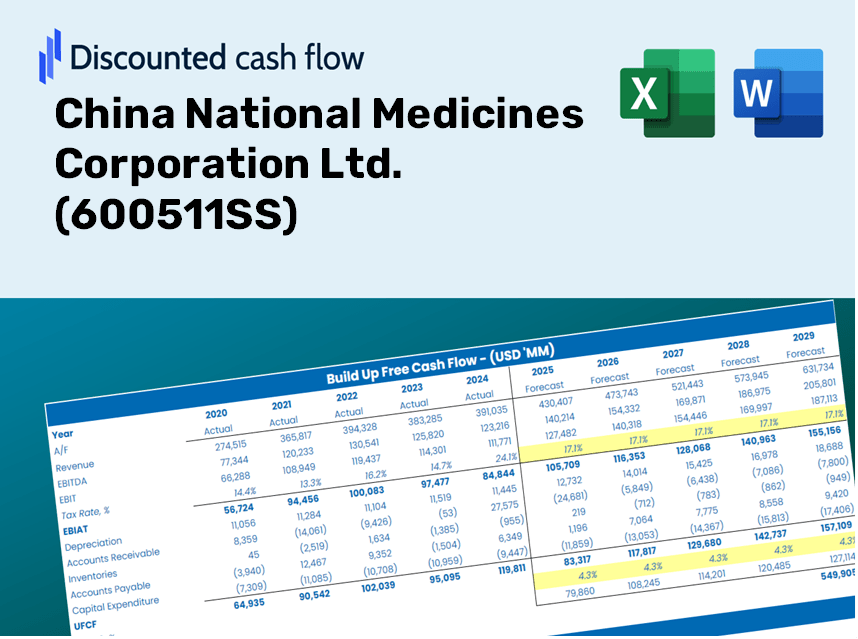
Discounted Cash Flow (DCF) - (USD MM)
| Year | AY1 2020 |
AY2 2021 |
AY3 2022 |
AY4 2023 |
AY5 2024 |
FY1 2025 |
FY2 2026 |
FY3 2027 |
FY4 2028 |
FY5 2029 |
|---|---|---|---|---|---|---|---|---|---|---|
| Revenue | 40,378.6 | 46,468.6 | 45,498.6 | 49,696.0 | 50,597.4 | 53,637.6 | 56,860.4 | 60,276.9 | 63,898.6 | 67,738.0 |
| Revenue Growth, % | 0 | 15.08 | -2.09 | 9.23 | 1.81 | 6.01 | 6.01 | 6.01 | 6.01 | 6.01 |
| EBITDA | 1,669.2 | 2,154.8 | 2,422.6 | 2,485.2 | 2,214.7 | 2,518.1 | 2,669.4 | 2,829.8 | 2,999.8 | 3,180.1 |
| EBITDA, % | 4.13 | 4.64 | 5.32 | 5 | 4.38 | 4.69 | 4.69 | 4.69 | 4.69 | 4.69 |
| Depreciation | 103.5 | 100.1 | 103.9 | 113.1 | 110.0 | 122.8 | 130.2 | 138.0 | 146.3 | 155.1 |
| Depreciation, % | 0.25623 | 0.21542 | 0.22827 | 0.22755 | 0.21746 | 0.22899 | 0.22899 | 0.22899 | 0.22899 | 0.22899 |
| EBIT | 1,565.7 | 2,054.7 | 2,318.7 | 2,372.1 | 2,104.7 | 2,395.3 | 2,539.2 | 2,691.8 | 2,853.5 | 3,025.0 |
| EBIT, % | 3.88 | 4.42 | 5.1 | 4.77 | 4.16 | 4.47 | 4.47 | 4.47 | 4.47 | 4.47 |
| Total Cash | 6,224.6 | 7,315.9 | 8,896.2 | 10,925.5 | 10,885.7 | 10,106.5 | 10,713.7 | 11,357.5 | 12,039.9 | 12,763.3 |
| Total Cash, percent | .0 | .0 | .0 | .0 | .0 | .0 | .0 | .0 | .0 | .0 |
| Account Receivables | 12,507.0 | 13,690.9 | 12,550.4 | 12,880.6 | 14,293.8 | 15,253.5 | 16,170.0 | 17,141.6 | 18,171.5 | 19,263.4 |
| Account Receivables, % | 30.97 | 29.46 | 27.58 | 25.92 | 28.25 | 28.44 | 28.44 | 28.44 | 28.44 | 28.44 |
| Inventories | 3,049.6 | 3,515.0 | 3,717.4 | 3,961.4 | 4,955.7 | 4,403.9 | 4,668.5 | 4,949.1 | 5,246.4 | 5,561.7 |
| Inventories, % | 7.55 | 7.56 | 8.17 | 7.97 | 9.79 | 8.21 | 8.21 | 8.21 | 8.21 | 8.21 |
| Accounts Payable | 8,990.3 | 10,057.8 | 9,916.7 | 10,943.1 | 12,086.2 | 11,973.2 | 12,692.6 | 13,455.2 | 14,263.7 | 15,120.7 |
| Accounts Payable, % | 22.27 | 21.64 | 21.8 | 22.02 | 23.89 | 22.32 | 22.32 | 22.32 | 22.32 | 22.32 |
| Capital Expenditure | -69.1 | -95.1 | -129.8 | -145.1 | -130.8 | -129.9 | -137.8 | -146.0 | -154.8 | -164.1 |
| Capital Expenditure, % | -0.17101 | -0.20458 | -0.28523 | -0.29202 | -0.25846 | -0.24226 | -0.24226 | -0.24226 | -0.24226 | -0.24226 |
| Tax Rate, % | 24.63 | 24.63 | 24.63 | 24.63 | 24.63 | 24.63 | 24.63 | 24.63 | 24.63 | 24.63 |
| EBITAT | 1,129.1 | 1,474.2 | 1,694.3 | 1,736.9 | 1,586.4 | 1,751.1 | 1,856.3 | 1,967.8 | 2,086.1 | 2,211.4 |
| Depreciation | ||||||||||
| Changes in Account Receivables | ||||||||||
| Changes in Inventories | ||||||||||
| Changes in Accounts Payable | ||||||||||
| Capital Expenditure | ||||||||||
| UFCF | -5,402.7 | 897.4 | 2,465.3 | 2,157.0 | 301.3 | 1,223.1 | 1,387.0 | 1,470.4 | 1,558.7 | 1,652.4 |
| WACC, % | 5.3 | 5.3 | 5.3 | 5.3 | 5.31 | 5.3 | 5.3 | 5.3 | 5.3 | 5.3 |
| PV UFCF | ||||||||||
| SUM PV UFCF | 6,215.2 | |||||||||
| Long Term Growth Rate, % | 0.50 | |||||||||
| Free cash flow (T + 1) | 1,661 | |||||||||
| Terminal Value | 34,566 | |||||||||
| Present Terminal Value | 26,694 | |||||||||
| Enterprise Value | 32,909 | |||||||||
| Net Debt | -10,140 | |||||||||
| Equity Value | 43,049 | |||||||||
| Diluted Shares Outstanding, MM | 755 | |||||||||
| Equity Value Per Share | 57.06 |
Benefits You'll Receive
- Pre-Filled Financial Model: Utilize actual data from China National Medicines Corporation Ltd. for accurate DCF valuation.
- Comprehensive Forecast Control: Modify revenue growth, profit margins, WACC, and other essential metrics.
- Real-Time Calculations: Automatic updates allow you to see changes in results immediately as you adjust inputs.
- Investor-Ready Template: A polished Excel file crafted for high-quality valuations.
- Flexible and Reusable: Designed for adaptability, enabling ongoing use for detailed projections.
Key Features
- Real-Time CNMC Data: Pre-populated with China National Medicines Corporation Ltd.'s historical financial data and future projections.
- Customizable Input Options: Modify revenue growth rates, profit margins, WACC, tax rates, and capital expenditures according to your needs.
- Dynamic Valuation Framework: Automatic recalculations of Net Present Value (NPV) and intrinsic value based on your provided inputs.
- Scenario Analysis: Develop various forecasting scenarios to explore different valuation outcomes.
- User-Friendly Interface: Designed to be intuitive and accessible for both professionals and novices.
How It Functions
- 1. Access the Template: Download and open the Excel file containing preloaded data for China National Medicines Corporation Ltd. (600511SS).
- 2. Adjust Assumptions: Update essential inputs such as growth rates, WACC, and capital expenditures.
- 3. View Results in Real-Time: The DCF model automatically computes intrinsic value and NPV for you.
- 4. Evaluate Scenarios: Explore different projections to assess various valuation results.
- 5. Present with Assurance: Provide professional valuation insights that support your decision-making process.
Why Opt for This Calculator?
- Designed for Experts: A sophisticated tool utilized by analysts, CFOs, and industry consultants.
- Accurate Market Data: Historical and projected financials for China National Medicines Corporation Ltd. (600511SS) included for precision.
- Scenario Analysis: Effortlessly test various forecasts and assumptions.
- Transparent Results: Automatically computes intrinsic value, NPV, and essential metrics.
- User-Friendly: Detailed step-by-step instructions to assist you throughout the process.
Who Should Utilize This Product?
- Investors: Gain precise estimates of China National Medicines Corporation Ltd.'s fair value before making investment choices.
- CFOs: Utilize a robust DCF model for comprehensive financial reporting and analysis.
- Consultants: Efficiently modify the template for valuation reports tailored for clients.
- Entrepreneurs: Discover financial modeling techniques employed by leading enterprises.
- Educators: Employ the tool as a resource for illustrating valuation methodologies.
Contents of the Template
- Pre-Filled Data: Contains China National Medicines Corporation Ltd.'s historical financial data and projections.
- Discounted Cash Flow Model: An editable DCF valuation model with automatic calculation features.
- Weighted Average Cost of Capital (WACC): A dedicated worksheet for calculating WACC using custom parameters.
- Key Financial Ratios: Assess China National Medicines Corporation Ltd.'s profitability, efficiency, and leverage metrics.
- Customizable Inputs: Easily modify revenue growth rates, profit margins, and tax rates.
- Clear Dashboard: Visual representations through charts and tables summarizing essential valuation outcomes.
Disclaimer
All information, articles, and product details provided on this website are for general informational and educational purposes only. We do not claim any ownership over, nor do we intend to infringe upon, any trademarks, copyrights, logos, brand names, or other intellectual property mentioned or depicted on this site. Such intellectual property remains the property of its respective owners, and any references here are made solely for identification or informational purposes, without implying any affiliation, endorsement, or partnership.
We make no representations or warranties, express or implied, regarding the accuracy, completeness, or suitability of any content or products presented. Nothing on this website should be construed as legal, tax, investment, financial, medical, or other professional advice. In addition, no part of this site—including articles or product references—constitutes a solicitation, recommendation, endorsement, advertisement, or offer to buy or sell any securities, franchises, or other financial instruments, particularly in jurisdictions where such activity would be unlawful.
All content is of a general nature and may not address the specific circumstances of any individual or entity. It is not a substitute for professional advice or services. Any actions you take based on the information provided here are strictly at your own risk. You accept full responsibility for any decisions or outcomes arising from your use of this website and agree to release us from any liability in connection with your use of, or reliance upon, the content or products found herein.