
|
Kangmei Pharmaceutical Co., Ltd. (600518.SS) Avaliação DCF |
Totalmente Editável: Adapte-Se Às Suas Necessidades No Excel Ou Planilhas
Design Profissional: Modelos Confiáveis E Padrão Da Indústria
Pré-Construídos Para Uso Rápido E Eficiente
Compatível com MAC/PC, totalmente desbloqueado
Não É Necessária Experiência; Fácil De Seguir
Kangmei Pharmaceutical Co., Ltd. (600518.SS) Bundle
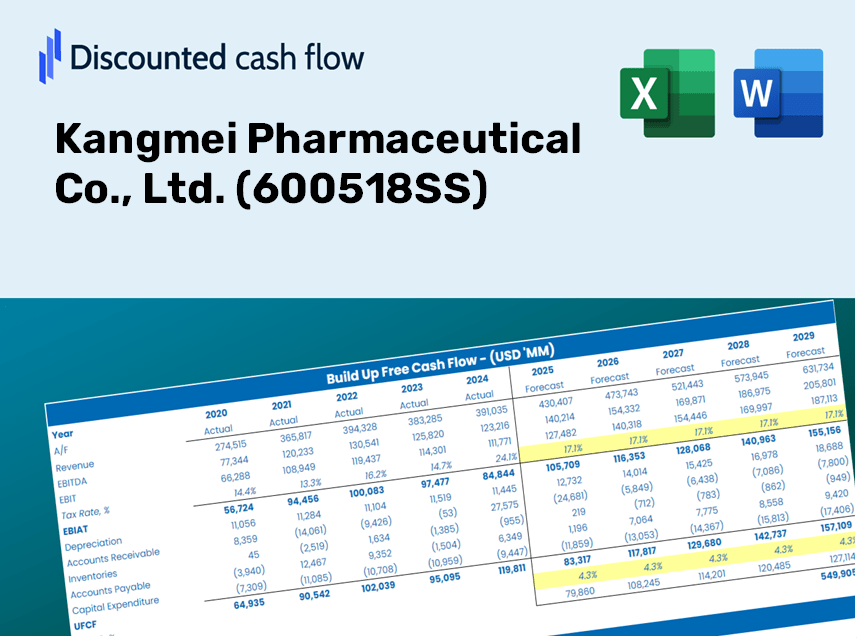
Aprimore suas estratégias de investimento com a calculadora DCF (600518SS)! Utilize dados financeiros farmacêuticos de Kangmei reais, ajuste as projeções e despesas de crescimento e observe instantaneamente como essas modificações afetam o valor intrínseco de (600518Ss).
Discounted Cash Flow (DCF) - (USD MM)
| Year | AY1 2020 |
AY2 2021 |
AY3 2022 |
AY4 2023 |
AY5 2024 |
FY1 2025 |
FY2 2026 |
FY3 2027 |
FY4 2028 |
FY5 2029 |
|---|---|---|---|---|---|---|---|---|---|---|
| Revenue | 5,412.0 | 4,152.5 | 4,180.2 | 4,874.0 | 5,189.1 | 5,195.1 | 5,201.0 | 5,207.0 | 5,212.9 | 5,218.9 |
| Revenue Growth, % | 0 | -23.27 | 0.66535 | 16.6 | 6.47 | 0.11442 | 0.11442 | 0.11442 | 0.11442 | 0.11442 |
| EBITDA | -28,061.3 | 9,863.3 | -2,219.5 | 512.7 | 396.0 | -363.1 | -363.5 | -363.9 | -364.3 | -364.7 |
| EBITDA, % | -518.5 | 237.53 | -53.1 | 10.52 | 7.63 | -6.99 | -6.99 | -6.99 | -6.99 | -6.99 |
| Depreciation | 644.8 | 638.2 | 393.1 | 346.2 | 340.0 | 523.1 | 523.7 | 524.3 | 524.9 | 525.5 |
| Depreciation, % | 11.91 | 15.37 | 9.4 | 7.1 | 6.55 | 10.07 | 10.07 | 10.07 | 10.07 | 10.07 |
| EBIT | -28,706.1 | 9,225.0 | -2,612.6 | 166.5 | 56.0 | -602.7 | -603.3 | -604.0 | -604.7 | -605.4 |
| EBIT, % | -530.42 | 222.15 | -62.5 | 3.42 | 1.08 | -11.6 | -11.6 | -11.6 | -11.6 | -11.6 |
| Total Cash | 552.3 | 2,419.1 | 1,507.5 | 1,056.7 | 977.9 | 1,507.1 | 1,508.8 | 1,510.6 | 1,512.3 | 1,514.0 |
| Total Cash, percent | .0 | .0 | .0 | .0 | .0 | .0 | .0 | .0 | .0 | .0 |
| Account Receivables | 2,487.0 | 2,512.0 | 2,046.1 | 2,094.9 | 3,049.9 | 2,671.8 | 2,674.9 | 2,677.9 | 2,681.0 | 2,684.1 |
| Account Receivables, % | 45.95 | 60.49 | 48.95 | 42.98 | 58.77 | 51.43 | 51.43 | 51.43 | 51.43 | 51.43 |
| Inventories | 5,708.8 | 3,194.9 | 2,750.7 | 2,643.7 | 2,510.4 | 3,588.4 | 3,592.5 | 3,596.6 | 3,600.7 | 3,604.8 |
| Inventories, % | 105.48 | 76.94 | 65.8 | 54.24 | 48.38 | 69.07 | 69.07 | 69.07 | 69.07 | 69.07 |
| Accounts Payable | 3,762.1 | 2,015.1 | 52.9 | 2,256.4 | 2,545.7 | 2,230.3 | 2,232.9 | 2,235.4 | 2,238.0 | 2,240.5 |
| Accounts Payable, % | 69.51 | 48.53 | 1.26 | 46.29 | 49.06 | 42.93 | 42.93 | 42.93 | 42.93 | 42.93 |
| Capital Expenditure | -301.7 | -171.6 | -48.1 | -99.7 | -61.7 | -146.4 | -146.6 | -146.8 | -147.0 | -147.1 |
| Capital Expenditure, % | -5.58 | -4.13 | -1.15 | -2.05 | -1.19 | -2.82 | -2.82 | -2.82 | -2.82 | -2.82 |
| Tax Rate, % | 75.26 | 75.26 | 75.26 | 75.26 | 75.26 | 75.26 | 75.26 | 75.26 | 75.26 | 75.26 |
| EBITAT | -28,764.0 | 8,956.5 | -2,642.2 | 154.7 | 13.9 | -499.9 | -500.4 | -501.0 | -501.6 | -502.2 |
| Depreciation | ||||||||||
| Changes in Account Receivables | ||||||||||
| Changes in Inventories | ||||||||||
| Changes in Accounts Payable | ||||||||||
| Capital Expenditure | ||||||||||
| UFCF | -32,854.6 | 10,165.0 | -3,349.4 | 2,662.8 | -240.2 | -1,138.5 | -128.0 | -128.1 | -128.3 | -128.4 |
| WACC, % | 6.65 | 6.65 | 6.65 | 6.65 | 6.6 | 6.64 | 6.64 | 6.64 | 6.64 | 6.64 |
| PV UFCF | ||||||||||
| SUM PV UFCF | -1,478.1 | |||||||||
| Long Term Growth Rate, % | 2.00 | |||||||||
| Free cash flow (T + 1) | -131 | |||||||||
| Terminal Value | -2,823 | |||||||||
| Present Terminal Value | -2,047 | |||||||||
| Enterprise Value | -3,525 | |||||||||
| Net Debt | -867 | |||||||||
| Equity Value | -2,658 | |||||||||
| Diluted Shares Outstanding, MM | 14,289 | |||||||||
| Equity Value Per Share | -0.19 |
Benefits You'll Receive
- Flexible Forecast Inputs: Effortlessly modify key assumptions (growth %, margins, WACC) to generate various scenarios.
- Insightful Data: Kangmei Pharmaceutical's financial information pre-populated to facilitate your analysis.
- Automated DCF Calculations: The model computes Net Present Value (NPV) and intrinsic value automatically.
- Professional and Adaptable: A sleek Excel model that customizes to fit your valuation requirements.
- Designed for Analysts and Investors: Perfect for assessing projections, validating strategies, and optimizing your time.
Key Features
- Authentic Financial Data: Access reliable pre-loaded historical figures and future estimates for Kangmei Pharmaceutical Co., Ltd. (600518SS).
- Adjustable Forecast Parameters: Modify highlighted cells representing WACC, growth rates, and profit margins as needed.
- Real-Time Calculations: Automatic adjustments to DCF, Net Present Value (NPV), and cash flow evaluations.
- User-Friendly Dashboard: Intuitive charts and summaries to help you visualize the valuation outcomes.
- Designed for All Levels: A straightforward and user-centric structure suitable for investors, CFOs, and consultants alike.
How It Works
- Download the Template: Gain immediate access to the Excel-based Kangmei Pharmaceutical DCF Calculator.
- Input Your Assumptions: Modify the yellow-highlighted cells for growth rates, WACC, profit margins, and more.
- Instant Calculations: The model automatically calculates the intrinsic value of Kangmei Pharmaceutical.
- Test Scenarios: Experiment with various assumptions to assess potential changes in valuation.
- Analyze and Decide: Utilize the results to inform your investment or financial strategies.
Why Opt for Kangmei Pharmaceutical's Financial Calculator?
- Precision: Utilizes actual Kangmei financial data to ensure reliability.
- Adaptability: Users can easily customize and experiment with various inputs.
- Efficiency: Bypass the complexities of creating a DCF model from the ground up.
- High-Quality Standards: Crafted with the expertise and thoroughness expected at the CFO level.
- Accessible: Intuitive design makes it simple for users without extensive financial modeling skills.
Who Can Benefit from This Product?
- Professional Investors: Develop comprehensive and trustworthy valuation models for assessing portfolios in Kangmei Pharmaceutical Co., Ltd. (600518SS).
- Corporate Finance Teams: Evaluate valuation scenarios to inform strategic decisions within the organization.
- Consultants and Advisors: Deliver precise valuation insights to clients interested in Kangmei Pharmaceutical Co., Ltd. (600518SS).
- Students and Educators: Utilize real-world data to enhance learning and practice in financial modeling.
- Pharmaceutical Enthusiasts: Gain insights into how companies like Kangmei Pharmaceutical Co., Ltd. (600518SS) are valued in the industry.
Contents of the Template
- Comprehensive DCF Model: An editable template featuring detailed valuation calculations.
- Real-World Data: Kangmei Pharmaceutical's historical and projected financial data preloaded for easy analysis.
- Customizable Parameters: Modify WACC, growth rates, and tax assumptions to explore various scenarios.
- Financial Statements: Complete annual and quarterly breakdowns for enhanced insights.
- Key Ratios: Embedded analysis for profitability, efficiency, and leverage metrics.
- Dashboard with Visual Outputs: Graphs and tables designed to present clear, actionable results.
Disclaimer
All information, articles, and product details provided on this website are for general informational and educational purposes only. We do not claim any ownership over, nor do we intend to infringe upon, any trademarks, copyrights, logos, brand names, or other intellectual property mentioned or depicted on this site. Such intellectual property remains the property of its respective owners, and any references here are made solely for identification or informational purposes, without implying any affiliation, endorsement, or partnership.
We make no representations or warranties, express or implied, regarding the accuracy, completeness, or suitability of any content or products presented. Nothing on this website should be construed as legal, tax, investment, financial, medical, or other professional advice. In addition, no part of this site—including articles or product references—constitutes a solicitation, recommendation, endorsement, advertisement, or offer to buy or sell any securities, franchises, or other financial instruments, particularly in jurisdictions where such activity would be unlawful.
All content is of a general nature and may not address the specific circumstances of any individual or entity. It is not a substitute for professional advice or services. Any actions you take based on the information provided here are strictly at your own risk. You accept full responsibility for any decisions or outcomes arising from your use of this website and agree to release us from any liability in connection with your use of, or reliance upon, the content or products found herein.