
|
KWEICHOW MOUTAI CO., LTD. (600519.SS) Avaliação DCF |
Totalmente Editável: Adapte-Se Às Suas Necessidades No Excel Ou Planilhas
Design Profissional: Modelos Confiáveis E Padrão Da Indústria
Pré-Construídos Para Uso Rápido E Eficiente
Compatível com MAC/PC, totalmente desbloqueado
Não É Necessária Experiência; Fácil De Seguir
Kweichow Moutai Co., Ltd. (600519.SS) Bundle
Explore Kweichow Moutai Co., Ltd. (600519Ss) Outlook financeiro com nossa calculadora DCF amigável! Digite suas projeções de crescimento, margens e despesas para determinar o Kweichow Moutai Co., Ltd. (600519Ss) valor intrínseco e moldar sua abordagem de investimento.
What You Will Receive
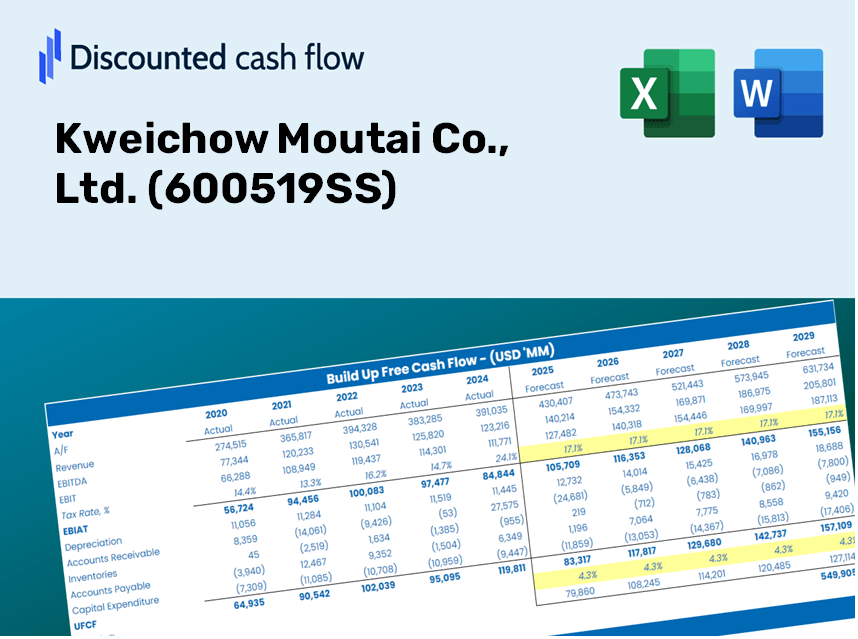
- Customizable Excel Template: A fully adjustable Excel-based DCF Calculator featuring pre-populated financial data for Kweichow Moutai Co., Ltd. (600519SS).
- Actual Market Data: Access to historical figures and future projections (highlighted in the yellow cells).
- Flexible Forecasting: Modify key assumptions such as revenue growth, EBITDA percentage, and WACC.
- Instant Calculations: Quickly observe how your inputs affect the valuation of Kweichow Moutai Co., Ltd. (600519SS).
- Professional Resource: Designed for investors, CFOs, consultants, and financial analysts.
- User-Friendly Layout: Organized for simplicity and ease of navigation, complete with step-by-step guidance.
Key Features
- Accurate Kweichow Moutai Financials: Gain access to precise historical data and forecasts for [600519SS].
- Tailorable Forecast Assumptions: Modify yellow-highlighted fields such as WACC, growth rates, and profit margins.
- Real-time Calculations: Enjoy automatic updates for DCF, Net Present Value (NPV), and cash flow analyses.
- Visual Analytics Dashboard: Utilize user-friendly charts and summaries to interpret your valuation outcomes.
- Designed for All Users: A straightforward, intuitive layout suitable for investors, CFOs, and consultants alike.
How It Functions
- Download: Get the pre-made Excel file containing Kweichow Moutai Co., Ltd.'s financial data.
- Customize: Modify projections for factors such as revenue growth, EBITDA %, and WACC.
- Real-Time Updates: Intrinsic value and NPV calculations refresh automatically as you make changes.
- Scenario Testing: Develop various forecasts and instantly compare different outcomes.
- Informed Decision-Making: Leverage the valuation findings to shape your investment approach.
Why Opt for This Calculator?
- All-in-One Solution: Features DCF, WACC, and financial ratio analyses seamlessly integrated.
- Adjustable Parameters: Modify yellow-highlighted cells to explore different financial scenarios.
- In-Depth Analysis: Automatically computes Kweichow Moutai’s intrinsic value and Net Present Value.
- Built-in Information: Historical and projected data provide reliable benchmarks.
- High-Caliber Tool: Perfect for financial analysts, investors, and business advisors.
Who Can Benefit from Kweichow Moutai Co., Ltd. (600519SS)?
- Investors: Gain confidence in your investment choices with a top-tier valuation tool.
- Financial Analysts: Increase efficiency with an easily customizable DCF model at your fingertips.
- Consultants: Seamlessly modify the template for impactful client presentations or reports.
- Finance Enthusiasts: Enhance your knowledge of valuation methods through practical, real-world applications.
- Educators and Students: Utilize this resource as a hands-on learning aid in finance-related courses.
Contents of the Template
- Operating and Balance Sheet Data: Pre-filled historical data and forecasts for Kweichow Moutai Co., Ltd. (600519SS), including revenue, EBITDA, EBIT, and capital expenditures.
- WACC Calculation: A dedicated sheet for calculating the Weighted Average Cost of Capital (WACC), featuring parameters such as Beta, risk-free rate, and share price.
- DCF Valuation (Unlevered and Levered): Customizable Discounted Cash Flow models that illustrate intrinsic value with comprehensive calculations.
- Financial Statements: Pre-loaded annual and quarterly financial statements to facilitate thorough analysis.
- Key Ratios: Includes profitability, leverage, and efficiency ratios specific to Kweichow Moutai Co., Ltd. (600519SS).
- Dashboard and Charts: A visual summary of valuation outputs and assumptions for easy analysis of results.
Disclaimer
All information, articles, and product details provided on this website are for general informational and educational purposes only. We do not claim any ownership over, nor do we intend to infringe upon, any trademarks, copyrights, logos, brand names, or other intellectual property mentioned or depicted on this site. Such intellectual property remains the property of its respective owners, and any references here are made solely for identification or informational purposes, without implying any affiliation, endorsement, or partnership.
We make no representations or warranties, express or implied, regarding the accuracy, completeness, or suitability of any content or products presented. Nothing on this website should be construed as legal, tax, investment, financial, medical, or other professional advice. In addition, no part of this site—including articles or product references—constitutes a solicitation, recommendation, endorsement, advertisement, or offer to buy or sell any securities, franchises, or other financial instruments, particularly in jurisdictions where such activity would be unlawful.
All content is of a general nature and may not address the specific circumstances of any individual or entity. It is not a substitute for professional advice or services. Any actions you take based on the information provided here are strictly at your own risk. You accept full responsibility for any decisions or outcomes arising from your use of this website and agree to release us from any liability in connection with your use of, or reliance upon, the content or products found herein.