
|
Wenyi Trinity Technology Co., Ltd (600520.SS) Avaliação DCF |
Totalmente Editável: Adapte-Se Às Suas Necessidades No Excel Ou Planilhas
Design Profissional: Modelos Confiáveis E Padrão Da Indústria
Pré-Construídos Para Uso Rápido E Eficiente
Compatível com MAC/PC, totalmente desbloqueado
Não É Necessária Experiência; Fácil De Seguir
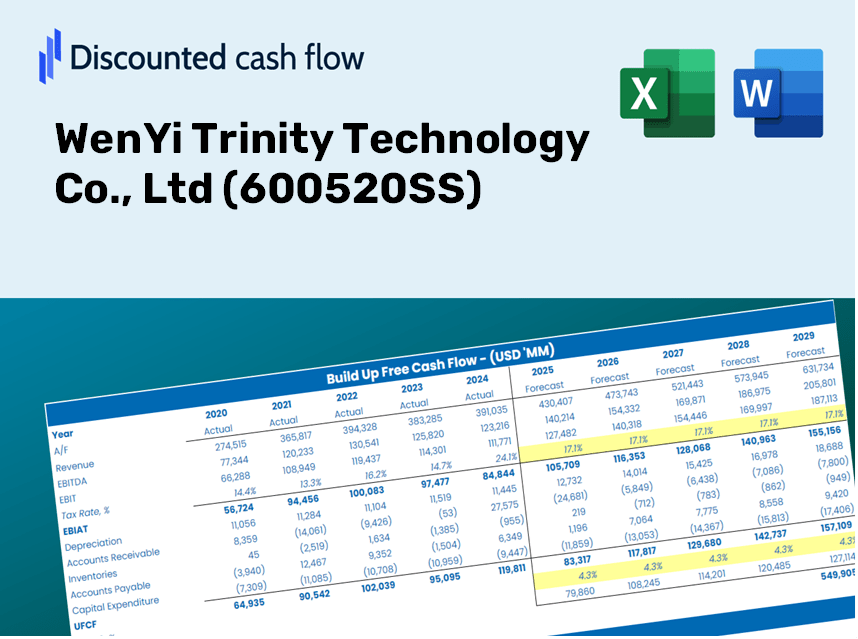
WenYi Trinity Technology Co., Ltd (600520.SS) Bundle
Projetado para precisão, nossa calculadora DCF (600520SS) permite avaliar a avaliação da Wenyi Trinity Technology Co., LTD usando dados financeiros do mundo real e oferece flexibilidade completa para modificar todos os parâmetros-chave para projeções aprimoradas.
Discounted Cash Flow (DCF) - (USD MM)
| Year | AY1 2020 |
AY2 2021 |
AY3 2022 |
AY4 2023 |
AY5 2024 |
FY1 2025 |
FY2 2026 |
FY3 2027 |
FY4 2028 |
FY5 2029 |
|---|---|---|---|---|---|---|---|---|---|---|
| Revenue | 332.0 | 443.9 | 444.5 | 330.7 | 314.4 | 317.0 | 319.6 | 322.2 | 324.8 | 327.5 |
| Revenue Growth, % | 0 | 33.7 | 0.12448 | -25.6 | -4.93 | 0.82204 | 0.82204 | 0.82204 | 0.82204 | 0.82204 |
| EBITDA | 25.1 | 40.4 | 58.2 | -58.0 | 32.7 | 14.4 | 14.5 | 14.6 | 14.7 | 14.8 |
| EBITDA, % | 7.56 | 9.1 | 13.1 | -17.54 | 10.41 | 4.53 | 4.53 | 4.53 | 4.53 | 4.53 |
| Depreciation | 21.8 | 19.8 | 18.1 | 15.8 | 8.5 | 14.3 | 14.4 | 14.6 | 14.7 | 14.8 |
| Depreciation, % | 6.56 | 4.47 | 4.08 | 4.77 | 2.71 | 4.52 | 4.52 | 4.52 | 4.52 | 4.52 |
| EBIT | 3.3 | 20.6 | 40.1 | -73.8 | 24.2 | .0 | .0 | .0 | .0 | .0 |
| EBIT, % | 1 | 4.63 | 9.02 | -22.31 | 7.7 | 0.00859733 | 0.00859733 | 0.00859733 | 0.00859733 | 0.00859733 |
| Total Cash | 232.3 | 118.3 | 104.1 | 126.2 | 127.6 | 126.0 | 127.0 | 128.1 | 129.1 | 130.2 |
| Total Cash, percent | .0 | .0 | .0 | .0 | .0 | .0 | .0 | .0 | .0 | .0 |
| Account Receivables | 112.3 | 143.6 | 224.7 | 271.6 | 200.7 | 166.5 | 167.9 | 169.3 | 170.6 | 172.0 |
| Account Receivables, % | 33.81 | 32.35 | 50.55 | 82.13 | 63.83 | 52.53 | 52.53 | 52.53 | 52.53 | 52.53 |
| Inventories | 109.6 | 156.6 | 146.5 | 135.5 | 94.9 | 109.3 | 110.2 | 111.1 | 112.0 | 112.9 |
| Inventories, % | 33 | 35.28 | 32.95 | 40.97 | 30.18 | 34.48 | 34.48 | 34.48 | 34.48 | 34.48 |
| Accounts Payable | 350.5 | 273.7 | 283.1 | 118.2 | 115.8 | 188.8 | 190.4 | 192.0 | 193.5 | 195.1 |
| Accounts Payable, % | 105.55 | 61.64 | 63.69 | 35.74 | 36.82 | 59.58 | 59.58 | 59.58 | 59.58 | 59.58 |
| Capital Expenditure | -8.7 | -2.2 | -5.1 | -6.7 | -32.5 | -10.5 | -10.6 | -10.7 | -10.8 | -10.9 |
| Capital Expenditure, % | -2.62 | -0.50178 | -1.14 | -2.01 | -10.33 | -3.32 | -3.32 | -3.32 | -3.32 | -3.32 |
| Tax Rate, % | 6.86 | 6.86 | 6.86 | 6.86 | 6.86 | 6.86 | 6.86 | 6.86 | 6.86 | 6.86 |
| EBITAT | 2.0 | 10.5 | 28.6 | -76.4 | 22.5 | .0 | .0 | .0 | .0 | .0 |
| Depreciation | ||||||||||
| Changes in Account Receivables | ||||||||||
| Changes in Inventories | ||||||||||
| Changes in Accounts Payable | ||||||||||
| Capital Expenditure | ||||||||||
| UFCF | 143.8 | -127.0 | -19.8 | -268.1 | 107.7 | 96.6 | 3.1 | 3.2 | 3.2 | 3.2 |
| WACC, % | 5.14 | 5.14 | 5.14 | 5.15 | 5.15 | 5.14 | 5.14 | 5.14 | 5.14 | 5.14 |
| PV UFCF | ||||||||||
| SUM PV UFCF | 102.6 | |||||||||
| Long Term Growth Rate, % | 4.00 | |||||||||
| Free cash flow (T + 1) | 3 | |||||||||
| Terminal Value | 293 | |||||||||
| Present Terminal Value | 228 | |||||||||
| Enterprise Value | 330 | |||||||||
| Net Debt | -86 | |||||||||
| Equity Value | 416 | |||||||||
| Diluted Shares Outstanding, MM | 156 | |||||||||
| Equity Value Per Share | 2.66 |
What You Will Receive
- Authentic WenYi Trinity Data: Comprehensive financial information – encompassing revenue to EBIT – derived from actual and projected metrics.
- Complete Customization: Modify all essential parameters (yellow cells) such as WACC, growth %, and tax rates.
- Immediate Valuation Adjustments: Automatic recalculations for assessing the effects of changes on WenYi Trinity's fair value.
- Flexible Excel Template: Designed for easy modifications, scenario analysis, and detailed forecasting.
- Efficient and Precise: Avoid starting models from scratch while ensuring accuracy and adaptability.
Key Features
- Comprehensive Historical Data: Pre-populated with WenYi Trinity Technology Co., Ltd’s (600520SS) past financial performance and future projections.
- Customizable Assumptions: Tailor revenue growth rates, profit margins, discount rates, tax assumptions, and capital investment estimates.
- Interactive Valuation Model: Automatic recalibration of Net Present Value (NPV) and intrinsic value in response to your adjustments.
- Flexible Scenario Analysis: Develop various forecasting scenarios to explore different valuation results.
- Intuitive User Interface: Designed to be straightforward and accessible for both seasoned professionals and newcomers.
How It Works
- Step 1: Download the ready-to-use Excel template featuring data for WenYi Trinity Technology Co., Ltd (600520SS).
- Step 2: Review the pre-populated sheets and familiarize yourself with the essential metrics.
- Step 3: Adjust forecasts and assumptions in the editable yellow cells (WACC, growth, margins).
- Step 4: Instantly view recalibrated results, including the intrinsic value of WenYi Trinity Technology Co., Ltd (600520SS).
- Step 5: Make well-informed investment choices or create reports based on the results.
Why Opt for WenYi Trinity Technology Co., Ltd (600520SS)?
- Reliability: Leveraging genuine WenYi data guarantees dependable insights.
- Adaptability: Tailored for users to explore and adjust parameters seamlessly.
- Efficiency: Eliminate the need to construct models from the ground up.
- Industry-Standard: Crafted with the expertise and precision expected at the executive level.
- Intuitive: Simple to navigate, even for those lacking extensive financial modeling skills.
Who Can Benefit from This Product?
- Professional Investors: Develop comprehensive and dependable valuation models for analyzing investment portfolios in WenYi Trinity Technology Co., Ltd (600520SS).
- Corporate Finance Teams: Evaluate valuation scenarios to inform strategic decisions within the company.
- Consultants and Advisors: Deliver precise valuation insights to clients focused on WenYi Trinity Technology Co., Ltd (600520SS).
- Students and Educators: Utilize real-world data to enhance financial modeling skills and teach important concepts.
- Tech Enthusiasts: Gain a deeper understanding of the valuation process for technology companies like WenYi Trinity Technology Co., Ltd (600520SS).
What the Template Offers
- Comprehensive DCF Model: An editable template featuring thorough valuation calculations.
- Real-World Data: Historical and projected financials for WenYi Trinity Technology Co., Ltd (600520SS) included for analysis.
- Customizable Parameters: Modify WACC, growth rates, and tax assumptions to explore various scenarios.
- Financial Statements: Complete annual and quarterly breakdowns for in-depth analysis.
- Key Ratios: Integrated analysis for assessing profitability, efficiency, and leverage.
- Dashboard with Visual Outputs: Visualizations and tables that provide clear, actionable insights.
Disclaimer
All information, articles, and product details provided on this website are for general informational and educational purposes only. We do not claim any ownership over, nor do we intend to infringe upon, any trademarks, copyrights, logos, brand names, or other intellectual property mentioned or depicted on this site. Such intellectual property remains the property of its respective owners, and any references here are made solely for identification or informational purposes, without implying any affiliation, endorsement, or partnership.
We make no representations or warranties, express or implied, regarding the accuracy, completeness, or suitability of any content or products presented. Nothing on this website should be construed as legal, tax, investment, financial, medical, or other professional advice. In addition, no part of this site—including articles or product references—constitutes a solicitation, recommendation, endorsement, advertisement, or offer to buy or sell any securities, franchises, or other financial instruments, particularly in jurisdictions where such activity would be unlawful.
All content is of a general nature and may not address the specific circumstances of any individual or entity. It is not a substitute for professional advice or services. Any actions you take based on the information provided here are strictly at your own risk. You accept full responsibility for any decisions or outcomes arising from your use of this website and agree to release us from any liability in connection with your use of, or reliance upon, the content or products found herein.