
|
China Railway Hi-Tech Industry Corporation Limited (600528.SS) Avaliação DCF |
Totalmente Editável: Adapte-Se Às Suas Necessidades No Excel Ou Planilhas
Design Profissional: Modelos Confiáveis E Padrão Da Indústria
Pré-Construídos Para Uso Rápido E Eficiente
Compatível com MAC/PC, totalmente desbloqueado
Não É Necessária Experiência; Fácil De Seguir
China Railway Hi-tech Industry Corporation Limited (600528.SS) Bundle
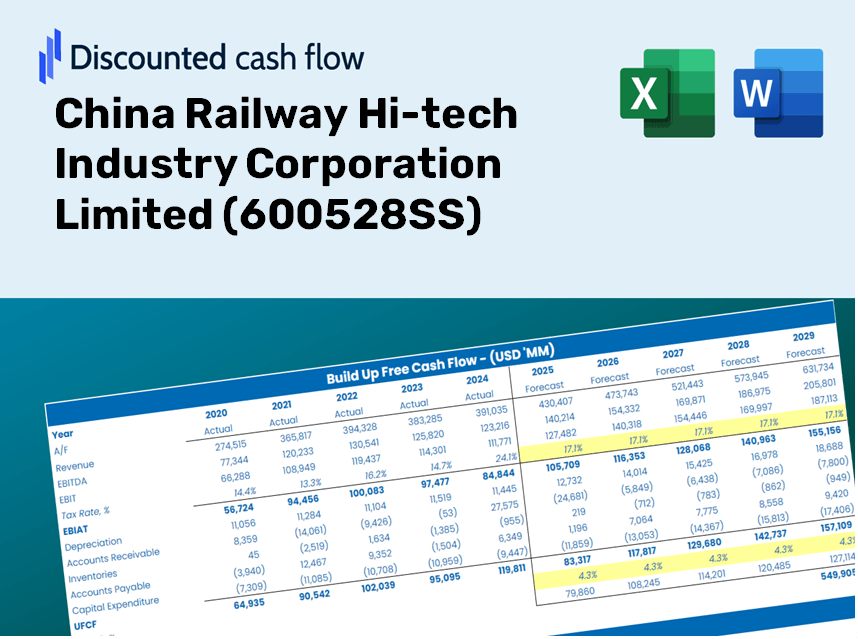
Aprimore suas estratégias de investimento com a calculadora DCF da China Railway Hi-Tech Industry Corporation Limited (600528Ss)! Utilize dados financeiros reais para a alta tecnologia da China, ajuste as premissas e despesas de crescimento e observe instantaneamente como essas variações afetam o valor intrínseco de (600528Ss).
Discounted Cash Flow (DCF) - (USD MM)
| Year | AY1 2020 |
AY2 2021 |
AY3 2022 |
AY4 2023 |
AY5 2024 |
FY1 2025 |
FY2 2026 |
FY3 2027 |
FY4 2028 |
FY5 2029 |
|---|---|---|---|---|---|---|---|---|---|---|
| Revenue | 24,291.8 | 27,157.2 | 28,817.1 | 30,067.0 | 29,003.2 | 30,359.6 | 31,779.5 | 33,265.7 | 34,821.5 | 36,450.0 |
| Revenue Growth, % | 0 | 11.8 | 6.11 | 4.34 | -3.54 | 4.68 | 4.68 | 4.68 | 4.68 | 4.68 |
| EBITDA | 2,476.1 | 2,569.0 | 2,721.8 | 2,535.9 | 2,610.4 | 2,825.4 | 2,957.6 | 3,095.9 | 3,240.7 | 3,392.2 |
| EBITDA, % | 10.19 | 9.46 | 9.45 | 8.43 | 9 | 9.31 | 9.31 | 9.31 | 9.31 | 9.31 |
| Depreciation | 551.8 | 668.5 | 736.9 | 636.4 | 702.7 | 718.3 | 751.9 | 787.0 | 823.8 | 862.4 |
| Depreciation, % | 2.27 | 2.46 | 2.56 | 2.12 | 2.42 | 2.37 | 2.37 | 2.37 | 2.37 | 2.37 |
| EBIT | 1,924.4 | 1,900.5 | 1,984.9 | 1,899.5 | 1,907.7 | 2,107.1 | 2,205.7 | 2,308.8 | 2,416.8 | 2,529.9 |
| EBIT, % | 7.92 | 7 | 6.89 | 6.32 | 6.58 | 6.94 | 6.94 | 6.94 | 6.94 | 6.94 |
| Total Cash | 7,785.1 | 7,511.2 | 7,621.3 | 6,980.6 | 6,897.3 | 8,084.9 | 8,463.0 | 8,858.8 | 9,273.1 | 9,706.8 |
| Total Cash, percent | .0 | .0 | .0 | .0 | .0 | .0 | .0 | .0 | .0 | .0 |
| Account Receivables | 9,458.7 | 11,589.9 | 14,598.9 | 16,919.6 | 20,637.9 | 15,769.1 | 16,506.6 | 17,278.6 | 18,086.7 | 18,932.6 |
| Account Receivables, % | 38.94 | 42.68 | 50.66 | 56.27 | 71.16 | 51.94 | 51.94 | 51.94 | 51.94 | 51.94 |
| Inventories | 12,735.6 | 14,801.2 | 16,111.1 | 17,490.9 | 20,429.7 | 17,696.6 | 18,524.3 | 19,390.6 | 20,297.5 | 21,246.7 |
| Inventories, % | 52.43 | 54.5 | 55.91 | 58.17 | 70.44 | 58.29 | 58.29 | 58.29 | 58.29 | 58.29 |
| Accounts Payable | 10,198.3 | 10,492.9 | 11,765.9 | 15,040.0 | 21,862.7 | 14,988.6 | 15,689.6 | 16,423.4 | 17,191.5 | 17,995.5 |
| Accounts Payable, % | 41.98 | 38.64 | 40.83 | 50.02 | 75.38 | 49.37 | 49.37 | 49.37 | 49.37 | 49.37 |
| Capital Expenditure | -1,170.1 | -1,708.0 | -833.7 | -1,192.9 | -589.3 | -1,214.3 | -1,271.1 | -1,330.5 | -1,392.8 | -1,457.9 |
| Capital Expenditure, % | -4.82 | -6.29 | -2.89 | -3.97 | -2.03 | -4 | -4 | -4 | -4 | -4 |
| Tax Rate, % | 5.06 | 5.06 | 5.06 | 5.06 | 5.06 | 5.06 | 5.06 | 5.06 | 5.06 | 5.06 |
| EBITAT | 1,730.1 | 1,696.4 | 1,790.3 | 1,741.9 | 1,811.2 | 1,921.8 | 2,011.6 | 2,105.7 | 2,204.2 | 2,307.3 |
| Depreciation | ||||||||||
| Changes in Account Receivables | ||||||||||
| Changes in Inventories | ||||||||||
| Changes in Accounts Payable | ||||||||||
| Capital Expenditure | ||||||||||
| UFCF | -10,884.2 | -3,245.3 | -1,352.4 | 758.9 | 2,090.2 | 2,153.5 | 628.3 | 657.7 | 688.4 | 720.6 |
| WACC, % | 6.03 | 6.02 | 6.03 | 6.03 | 6.04 | 6.03 | 6.03 | 6.03 | 6.03 | 6.03 |
| PV UFCF | ||||||||||
| SUM PV UFCF | 4,224.1 | |||||||||
| Long Term Growth Rate, % | 3.00 | |||||||||
| Free cash flow (T + 1) | 742 | |||||||||
| Terminal Value | 24,501 | |||||||||
| Present Terminal Value | 18,283 | |||||||||
| Enterprise Value | 22,507 | |||||||||
| Net Debt | -6,668 | |||||||||
| Equity Value | 29,175 | |||||||||
| Diluted Shares Outstanding, MM | 2,329 | |||||||||
| Equity Value Per Share | 12.53 |
Benefits You Will Enjoy
- Authentic 600528SS Financial Data: Comes pre-populated with historical and forecasted data for accurate analysis.
- Customizable Template: Easily adjust key parameters such as revenue growth, WACC, and EBITDA percentage.
- Instant Calculations: Watch as the intrinsic value of China Railway Hi-tech Industry Corporation Limited updates in real-time with your modifications.
- Professional Valuation Tool: Tailored for investors, analysts, and consultants aiming for reliable DCF outcomes.
- User-Friendly Interface: Intuitive layout and straightforward instructions suitable for all skill levels.
Key Features
- 🔍 Real-Life (600528SS) Financials: Pre-filled historical and projected data for China Railway Hi-tech Industry Corporation Limited.
- ✏️ Fully Customizable Inputs: Adjust all critical parameters (yellow cells) like WACC, growth %, and tax rates.
- 📊 Professional DCF Valuation: Built-in formulas calculate (600528SS)’s intrinsic value using the Discounted Cash Flow method.
- ⚡ Instant Results: Visualize (600528SS)’s valuation instantly after making changes.
- Scenario Analysis: Test and compare outcomes for various financial assumptions side-by-side.
How It Functions
- Download: Obtain the pre-prepared Excel file containing the financial data for China Railway Hi-tech Industry Corporation Limited (600528SS).
- Customize: Modify forecasts, including revenue growth, EBITDA %, and WACC as needed.
- Update Automatically: The intrinsic value and NPV calculations refresh in real-time.
- Test Scenarios: Generate various projections and instantly compare the results.
- Make Decisions: Utilize the valuation findings to inform your investment strategy.
Why Select Our Calculator for China Railway Hi-tech Industry Corporation Limited (600528SS)?
- Time-Efficient: Skip the hassle of building a DCF model from the ground up – our tool is ready for immediate use.
- Enhanced Accuracy: Dependable financial data and calculations minimize valuation discrepancies.
- Completely Customizable: Adjust the model to align with your unique assumptions and forecasts.
- User-Friendly Interpretation: Intuitive charts and outputs simplify the analysis of results.
- Favored by Professionals: Crafted for experts who prioritize both precision and ease of use.
Who Can Benefit from This Product?
- Investors: Make informed choices with a top-tier valuation tool tailored for precision.
- Financial Analysts: Streamline your workflow with an easily customizable DCF model.
- Consultants: Effortlessly modify the template for client presentations or comprehensive reports.
- Finance Enthusiasts: Enhance your knowledge of valuation methods through practical, real-world examples.
- Educators and Students: Utilize this resource as an effective teaching aid in finance courses.
Contents of the Template
- Preloaded CRHI Data: Historical and forecasted financial information, including revenue, EBIT, and capital expenditures.
- DCF and WACC Models: Advanced sheets for calculating intrinsic value and Weighted Average Cost of Capital.
- Editable Inputs: Yellow-highlighted cells for modifying revenue growth, tax rates, and discount rates.
- Financial Statements: Detailed annual and quarterly financials for in-depth analysis.
- Key Ratios: Ratios for profitability, leverage, and efficiency to assess performance.
- Dashboard and Charts: Visual representations of valuation results and underlying assumptions.
Disclaimer
All information, articles, and product details provided on this website are for general informational and educational purposes only. We do not claim any ownership over, nor do we intend to infringe upon, any trademarks, copyrights, logos, brand names, or other intellectual property mentioned or depicted on this site. Such intellectual property remains the property of its respective owners, and any references here are made solely for identification or informational purposes, without implying any affiliation, endorsement, or partnership.
We make no representations or warranties, express or implied, regarding the accuracy, completeness, or suitability of any content or products presented. Nothing on this website should be construed as legal, tax, investment, financial, medical, or other professional advice. In addition, no part of this site—including articles or product references—constitutes a solicitation, recommendation, endorsement, advertisement, or offer to buy or sell any securities, franchises, or other financial instruments, particularly in jurisdictions where such activity would be unlawful.
All content is of a general nature and may not address the specific circumstances of any individual or entity. It is not a substitute for professional advice or services. Any actions you take based on the information provided here are strictly at your own risk. You accept full responsibility for any decisions or outcomes arising from your use of this website and agree to release us from any liability in connection with your use of, or reliance upon, the content or products found herein.