
|
Shanxi Coal International Energy Group Co., Ltd (600546.SS) Avaliação DCF |
Totalmente Editável: Adapte-Se Às Suas Necessidades No Excel Ou Planilhas
Design Profissional: Modelos Confiáveis E Padrão Da Indústria
Pré-Construídos Para Uso Rápido E Eficiente
Compatível com MAC/PC, totalmente desbloqueado
Não É Necessária Experiência; Fácil De Seguir
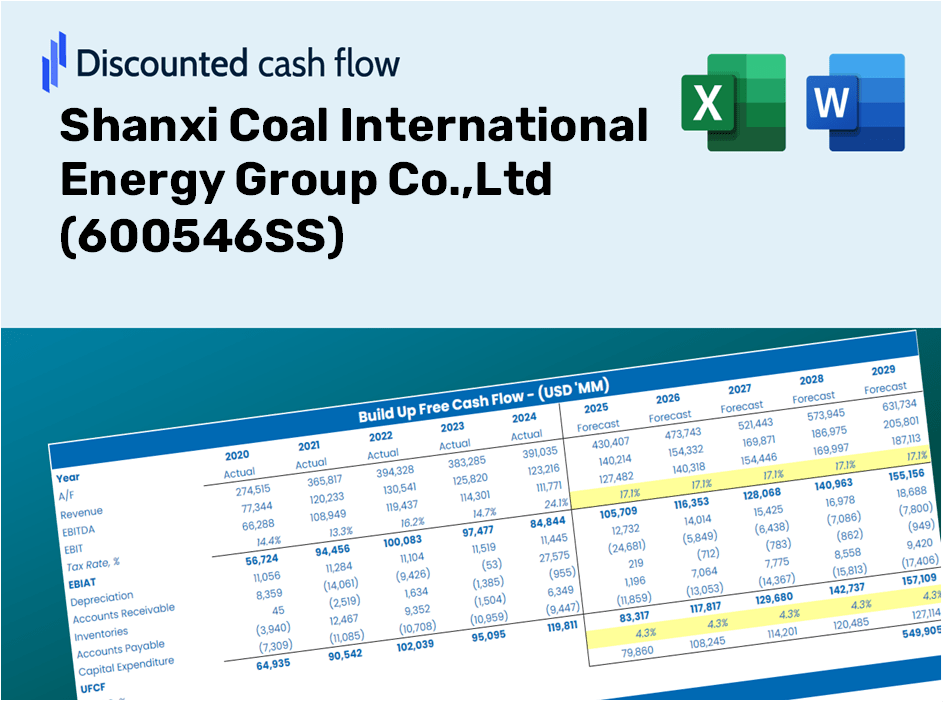
Shanxi Coal International Energy Group Co.,Ltd (600546.SS) Bundle
Avalie as perspectivas financeiras da Shanxi Coal International Energy Group Co., Ltd com experiência! Esta calculadora (600546SS) DCF fornece dados financeiros pré-preenchidos, permitindo que você complete a flexibilidade para modificar o crescimento da receita, o WACC, as margens e outras suposições essenciais para se alinhar com suas previsões.
Discounted Cash Flow (DCF) - (USD MM)
| Year | AY1 2020 |
AY2 2021 |
AY3 2022 |
AY4 2023 |
AY5 2024 |
FY1 2025 |
FY2 2026 |
FY3 2027 |
FY4 2028 |
FY5 2029 |
|---|---|---|---|---|---|---|---|---|---|---|
| Revenue | 35,422.1 | 48,053.6 | 46,394.0 | 37,370.8 | 29,560.7 | 28,959.0 | 28,369.6 | 27,792.2 | 27,226.5 | 26,672.3 |
| Revenue Growth, % | 0 | 35.66 | -3.45 | -19.45 | -20.9 | -2.04 | -2.04 | -2.04 | -2.04 | -2.04 |
| EBITDA | 4,429.2 | 13,781.7 | 17,405.3 | 11,502.9 | 6,788.5 | 7,671.0 | 7,514.8 | 7,361.9 | 7,212.0 | 7,065.3 |
| EBITDA, % | 12.5 | 28.68 | 37.52 | 30.78 | 22.96 | 26.49 | 26.49 | 26.49 | 26.49 | 26.49 |
| Depreciation | 1,113.9 | 1,126.4 | 1,335.0 | 1,513.5 | 1,529.8 | 1,018.8 | 998.1 | 977.8 | 957.9 | 938.4 |
| Depreciation, % | 3.14 | 2.34 | 2.88 | 4.05 | 5.18 | 3.52 | 3.52 | 3.52 | 3.52 | 3.52 |
| EBIT | 3,315.3 | 12,655.3 | 16,070.3 | 9,989.4 | 5,258.7 | 6,652.1 | 6,516.7 | 6,384.1 | 6,254.2 | 6,126.9 |
| EBIT, % | 9.36 | 26.34 | 34.64 | 26.73 | 17.79 | 22.97 | 22.97 | 22.97 | 22.97 | 22.97 |
| Total Cash | 5,305.0 | 11,920.5 | 10,255.4 | 6,371.7 | 6,426.4 | 5,831.1 | 5,712.4 | 5,596.1 | 5,482.2 | 5,370.6 |
| Total Cash, percent | .0 | .0 | .0 | .0 | .0 | .0 | .0 | .0 | .0 | .0 |
| Account Receivables | 2,841.3 | 2,268.0 | 2,079.4 | 632.6 | 438.1 | 1,181.4 | 1,157.4 | 1,133.8 | 1,110.7 | 1,088.1 |
| Account Receivables, % | 8.02 | 4.72 | 4.48 | 1.69 | 1.48 | 4.08 | 4.08 | 4.08 | 4.08 | 4.08 |
| Inventories | 1,299.1 | 1,543.5 | 1,015.6 | 503.2 | 565.1 | 713.9 | 699.4 | 685.2 | 671.2 | 657.6 |
| Inventories, % | 3.67 | 3.21 | 2.19 | 1.35 | 1.91 | 2.47 | 2.47 | 2.47 | 2.47 | 2.47 |
| Accounts Payable | 4,120.2 | 5,364.8 | 4,253.9 | 4,766.0 | 5,004.2 | 3,570.5 | 3,497.8 | 3,426.6 | 3,356.8 | 3,288.5 |
| Accounts Payable, % | 11.63 | 11.16 | 9.17 | 12.75 | 16.93 | 12.33 | 12.33 | 12.33 | 12.33 | 12.33 |
| Capital Expenditure | -662.1 | -640.4 | -1,645.1 | -1,945.5 | -1,901.8 | -1,065.0 | -1,043.3 | -1,022.0 | -1,001.2 | -980.9 |
| Capital Expenditure, % | -1.87 | -1.33 | -3.55 | -5.21 | -6.43 | -3.68 | -3.68 | -3.68 | -3.68 | -3.68 |
| Tax Rate, % | 52.04 | 52.04 | 52.04 | 52.04 | 52.04 | 52.04 | 52.04 | 52.04 | 52.04 | 52.04 |
| EBITAT | 1,536.7 | 5,680.4 | 7,390.1 | 4,480.8 | 2,522.2 | 3,060.5 | 2,998.2 | 2,937.2 | 2,877.4 | 2,818.8 |
| Depreciation | ||||||||||
| Changes in Account Receivables | ||||||||||
| Changes in Inventories | ||||||||||
| Changes in Accounts Payable | ||||||||||
| Capital Expenditure | ||||||||||
| UFCF | 1,968.2 | 7,739.9 | 6,685.5 | 6,520.1 | 2,520.9 | 688.6 | 2,919.0 | 2,859.5 | 2,801.3 | 2,744.3 |
| WACC, % | 4.24 | 4.22 | 4.23 | 4.22 | 4.26 | 4.23 | 4.23 | 4.23 | 4.23 | 4.23 |
| PV UFCF | ||||||||||
| SUM PV UFCF | 10,476.8 | |||||||||
| Long Term Growth Rate, % | 0.50 | |||||||||
| Free cash flow (T + 1) | 2,758 | |||||||||
| Terminal Value | 73,916 | |||||||||
| Present Terminal Value | 60,082 | |||||||||
| Enterprise Value | 70,559 | |||||||||
| Net Debt | -1,217 | |||||||||
| Equity Value | 71,776 | |||||||||
| Diluted Shares Outstanding, MM | 1,990 | |||||||||
| Equity Value Per Share | 36.07 |
Your Benefits
- Customizable Excel Template: An editable Excel DCF Calculator featuring pre-populated financial data for Shanxi Coal International Energy Group Co.,Ltd (600546SS).
- Authentic Data: Comprehensive historical data and forward-looking projections (highlighted in the yellow cells).
- Flexible Forecasting: Adjust key assumptions such as revenue growth, EBITDA %, and WACC to suit your analysis.
- Instant Calculations: Quickly see how your inputs influence the valuation of Shanxi Coal International Energy Group Co.,Ltd (600546SS).
- Professional-Grade Tool: Designed for investors, CFOs, consultants, and financial analysts.
- User-Centric Layout: Organized for simplicity and ease of navigation, complete with step-by-step guidance.
Key Features
- Real-Time 600546SS Data: Pre-loaded with Shanxi Coal International Energy Group Co., Ltd's historical financials and future projections.
- Fully Customizable Parameters: Tailor inputs for revenue growth, profit margins, WACC, tax rates, and capital expenditures.
- Dynamic Valuation Framework: Instant updates to Net Present Value (NPV) and intrinsic value based on your modifications.
- Scenario Analysis: Develop various forecasting scenarios to assess different valuation results.
- User-Centric Interface: Intuitive, organized, and crafted for both seasoned professionals and novices.
How It Operates
- Download the Template: Obtain immediate access to the Excel-based (600546SS) DCF Calculator.
- Input Your Assumptions: Modify the yellow-highlighted cells to set growth rates, WACC, margins, and other variables.
- Instant Calculations: The model automatically recalculates the intrinsic value of Shanxi Coal International Energy Group.
- Test Scenarios: Experiment with various assumptions to assess potential changes in valuation.
- Analyze and Decide: Utilize the results to inform your investment strategies or financial assessments.
Why Choose This Calculator for Shanxi Coal International Energy Group Co., Ltd (600546SS)?
- Reliable Data: Access accurate financial information for dependable valuation outcomes.
- Fully Customizable: Tailor essential parameters such as growth rates, WACC, and tax rates to align with your forecasts.
- Efficient: Built-in calculations save you the hassle of starting from the ground up.
- Professional Quality: Crafted for use by investors, analysts, and consultants in the energy sector.
- Easy to Use: User-friendly interface and clear instructions ensure accessibility for everyone.
Who Should Use This Product?
- Individual Investors: Make informed decisions about buying or selling Shanxi Coal International Energy Group Co., Ltd (600546SS).
- Financial Analysts: Streamline valuation processes with easy-to-use financial models for Shanxi Coal International Energy Group Co., Ltd (600546SS).
- Consultants: Provide professional valuation insights to clients quickly and accurately using Shanxi Coal International Energy Group Co., Ltd (600546SS) data.
- Business Owners: Gain insights into how large companies like Shanxi Coal International Energy Group Co., Ltd (600546SS) are valued to inform your own strategic decisions.
- Finance Students: Learn valuation techniques with real-world data and scenarios involving Shanxi Coal International Energy Group Co., Ltd (600546SS).
Contents of the Template
- Comprehensive DCF Model: An editable template featuring thorough valuation calculations.
- Real-World Data: Historical and projected financials for Shanxi Coal International Energy Group Co., Ltd (600546SS) included for in-depth analysis.
- Customizable Parameters: Modify WACC, growth rates, and tax assumptions to evaluate different scenarios.
- Financial Statements: Complete annual and quarterly reports providing valuable insights.
- Key Ratios: Integrated analysis covering profitability, efficiency, and leverage metrics.
- Dashboard with Visual Outputs: Visual representations through charts and tables for straightforward, actionable insights.
Disclaimer
All information, articles, and product details provided on this website are for general informational and educational purposes only. We do not claim any ownership over, nor do we intend to infringe upon, any trademarks, copyrights, logos, brand names, or other intellectual property mentioned or depicted on this site. Such intellectual property remains the property of its respective owners, and any references here are made solely for identification or informational purposes, without implying any affiliation, endorsement, or partnership.
We make no representations or warranties, express or implied, regarding the accuracy, completeness, or suitability of any content or products presented. Nothing on this website should be construed as legal, tax, investment, financial, medical, or other professional advice. In addition, no part of this site—including articles or product references—constitutes a solicitation, recommendation, endorsement, advertisement, or offer to buy or sell any securities, franchises, or other financial instruments, particularly in jurisdictions where such activity would be unlawful.
All content is of a general nature and may not address the specific circumstances of any individual or entity. It is not a substitute for professional advice or services. Any actions you take based on the information provided here are strictly at your own risk. You accept full responsibility for any decisions or outcomes arising from your use of this website and agree to release us from any liability in connection with your use of, or reliance upon, the content or products found herein.