
|
Xiamen Tungsten Co., Ltd. (600549.Ss) Avaliação DCF |
Totalmente Editável: Adapte-Se Às Suas Necessidades No Excel Ou Planilhas
Design Profissional: Modelos Confiáveis E Padrão Da Indústria
Pré-Construídos Para Uso Rápido E Eficiente
Compatível com MAC/PC, totalmente desbloqueado
Não É Necessária Experiência; Fácil De Seguir
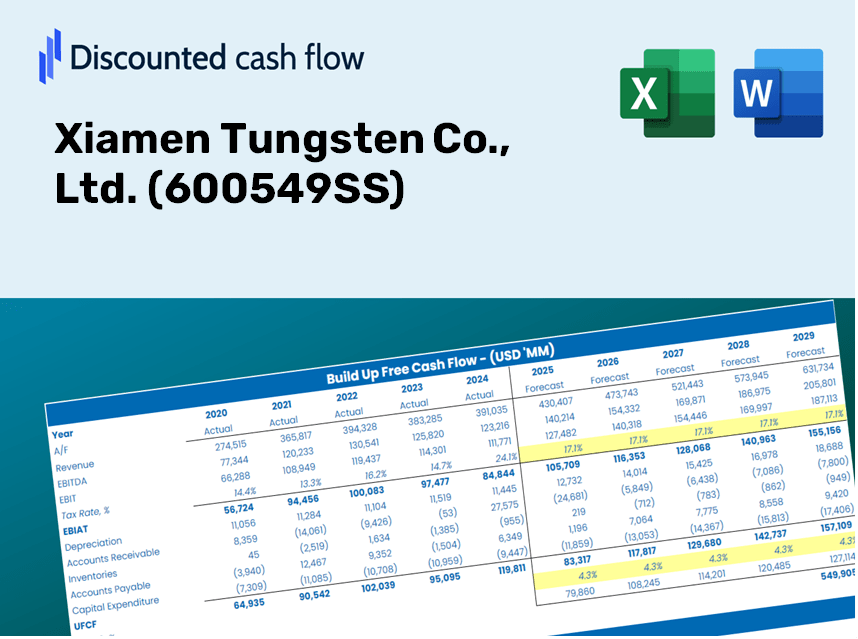
Xiamen Tungsten Co., Ltd. (600549.SS) Bundle
Procurando avaliar o valor intrínseco da Xiamen Tungsten Co., Ltd.? Nossa calculadora DCF (600549SS) integra dados do mundo real com extensos recursos de personalização, permitindo refinar suas projeções e aprimorar suas opções de investimento.
Discounted Cash Flow (DCF) - (USD MM)
| Year | AY1 2020 |
AY2 2021 |
AY3 2022 |
AY4 2023 |
AY5 2024 |
FY1 2025 |
FY2 2026 |
FY3 2027 |
FY4 2028 |
FY5 2029 |
|---|---|---|---|---|---|---|---|---|---|---|
| Revenue | 18,963.7 | 31,852.2 | 48,222.8 | 39,397.9 | 35,196.5 | 43,150.4 | 52,901.8 | 64,856.9 | 79,513.7 | 97,482.8 |
| Revenue Growth, % | 0 | 67.96 | 51.4 | -18.3 | -10.66 | 22.6 | 22.6 | 22.6 | 22.6 | 22.6 |
| EBITDA | 2,114.3 | 3,081.0 | 3,883.9 | 4,206.3 | 4,274.0 | 4,461.4 | 5,469.6 | 6,705.7 | 8,221.1 | 10,078.9 |
| EBITDA, % | 11.15 | 9.67 | 8.05 | 10.68 | 12.14 | 10.34 | 10.34 | 10.34 | 10.34 | 10.34 |
| Depreciation | 845.4 | 918.0 | 1,018.4 | 1,123.1 | 1,155.3 | 1,345.0 | 1,648.9 | 2,021.6 | 2,478.4 | 3,038.5 |
| Depreciation, % | 4.46 | 2.88 | 2.11 | 2.85 | 3.28 | 3.12 | 3.12 | 3.12 | 3.12 | 3.12 |
| EBIT | 1,269.0 | 2,162.9 | 2,865.6 | 3,083.3 | 3,118.7 | 3,116.4 | 3,820.7 | 4,684.1 | 5,742.7 | 7,040.4 |
| EBIT, % | 6.69 | 6.79 | 5.94 | 7.83 | 8.86 | 7.22 | 7.22 | 7.22 | 7.22 | 7.22 |
| Total Cash | 1,145.5 | 1,751.0 | 2,622.1 | 3,355.3 | 7,476.8 | 4,033.3 | 4,944.7 | 6,062.2 | 7,432.1 | 9,111.7 |
| Total Cash, percent | .0 | .0 | .0 | .0 | .0 | .0 | .0 | .0 | .0 | .0 |
| Account Receivables | 4,474.9 | 6,813.9 | 9,510.2 | 7,930.5 | 7,598.1 | 9,184.8 | 11,260.5 | 13,805.2 | 16,924.9 | 20,749.8 |
| Account Receivables, % | 23.6 | 21.39 | 19.72 | 20.13 | 21.59 | 21.29 | 21.29 | 21.29 | 21.29 | 21.29 |
| Inventories | 5,261.1 | 8,076.6 | 8,707.2 | 7,418.9 | 8,383.5 | 9,821.5 | 12,041.0 | 14,762.2 | 18,098.2 | 22,188.2 |
| Inventories, % | 27.74 | 25.36 | 18.06 | 18.83 | 23.82 | 22.76 | 22.76 | 22.76 | 22.76 | 22.76 |
| Accounts Payable | 2,738.1 | 4,707.4 | 4,799.6 | 4,759.1 | 6,693.8 | 6,064.3 | 7,434.7 | 9,114.8 | 11,174.7 | 13,700.0 |
| Accounts Payable, % | 14.44 | 14.78 | 9.95 | 12.08 | 19.02 | 14.05 | 14.05 | 14.05 | 14.05 | 14.05 |
| Capital Expenditure | -993.6 | -1,316.4 | -1,732.7 | -2,103.8 | -2,114.5 | -2,098.2 | -2,572.4 | -3,153.7 | -3,866.4 | -4,740.2 |
| Capital Expenditure, % | -5.24 | -4.13 | -3.59 | -5.34 | -6.01 | -4.86 | -4.86 | -4.86 | -4.86 | -4.86 |
| Tax Rate, % | 46.74 | 46.74 | 46.74 | 46.74 | 46.74 | 46.74 | 46.74 | 46.74 | 46.74 | 46.74 |
| EBITAT | 724.5 | 1,317.0 | 1,611.5 | 1,693.0 | 1,661.1 | 1,760.1 | 2,157.9 | 2,645.5 | 3,243.4 | 3,976.4 |
| Depreciation | ||||||||||
| Changes in Account Receivables | ||||||||||
| Changes in Inventories | ||||||||||
| Changes in Accounts Payable | ||||||||||
| Capital Expenditure | ||||||||||
| UFCF | -6,421.6 | -2,266.5 | -2,337.6 | 3,539.8 | 2,004.5 | -2,647.4 | -1,690.3 | -2,072.3 | -2,540.6 | -3,114.8 |
| WACC, % | 5.86 | 5.89 | 5.85 | 5.84 | 5.83 | 5.86 | 5.86 | 5.86 | 5.86 | 5.86 |
| PV UFCF | ||||||||||
| SUM PV UFCF | -10,123.1 | |||||||||
| Long Term Growth Rate, % | 3.50 | |||||||||
| Free cash flow (T + 1) | -3,224 | |||||||||
| Terminal Value | -136,806 | |||||||||
| Present Terminal Value | -102,924 | |||||||||
| Enterprise Value | -113,047 | |||||||||
| Net Debt | 1,596 | |||||||||
| Equity Value | -114,644 | |||||||||
| Diluted Shares Outstanding, MM | 1,429 | |||||||||
| Equity Value Per Share | -80.24 |
What You Will Receive
- Accurate Xiamen Tungsten Financial Data: Pre-filled with historical and forecasted data for detailed analysis of [600549SS].
- Customizable Template: Easily adjust key inputs such as revenue growth, WACC, and EBITDA percentage.
- Real-Time Calculations: Instantly view updates to Xiamen Tungsten’s intrinsic value as you make changes.
- Professional Valuation Resource: Tailored for investors, analysts, and consultants aiming for precise DCF outcomes.
- Intuitive Interface: Straightforward layout and clear guidelines suitable for all skill levels.
Key Features
- Comprehensive DCF Calculator: Offers both unlevered and levered DCF valuation models tailored for Xiamen Tungsten Co., Ltd. (600549SS).
- WACC Calculator: Features a customizable Weighted Average Cost of Capital sheet designed for precise financial analysis.
- Adjustable Forecast Assumptions: Easily alter growth rates, capital expenditures, and discount rates specific to Xiamen Tungsten Co., Ltd. (600549SS).
- Integrated Financial Ratios: Evaluate profitability, leverage, and efficiency ratios relevant to Xiamen Tungsten Co., Ltd. (600549SS).
- Interactive Dashboard and Charts: Provides visual summaries of crucial valuation metrics for swift and clear analysis.
How It Functions
- Download the Template: Gain immediate access to the Excel-based Xiamen Tungsten Co., Ltd. (600549SS) DCF Calculator.
- Input Your Assumptions: Modify the yellow-highlighted cells for growth rates, WACC, profit margins, and more.
- Instant Calculations: The model automatically recalculates the intrinsic value of Xiamen Tungsten Co., Ltd. (600549SS).
- Test Scenarios: Explore various assumptions to assess potential valuation shifts.
- Analyze and Decide: Utilize the findings to inform your investment or financial strategies.
Why Opt for Xiamen Tungsten Co., Ltd. ([600549SS])?
- Reliability: Based on accurate and up-to-date financials for trustworthy insights.
- Adaptability: Tailored for users to experiment with and adjust inputs as needed.
- Efficiency: Eliminate the complexity of creating financial models from the ground up.
- Expert Quality: Crafted with the precision and functionality expected by industry leaders.
- Intuitive Design: Simple to navigate, making it accessible for users with varying levels of financial expertise.
Who Can Benefit from This Product?
- Finance Students: Understand advanced valuation methods and practice with real-world data.
- Researchers: Utilize industry-standard models for academic projects and studies.
- Investors: Validate your hypotheses and assess valuation scenarios for Xiamen Tungsten Co., Ltd. (600549SS).
- Financial Analysts: Optimize your analysis process with a customizable DCF model designed for ease of use.
- Entrepreneurs: Explore how major companies like Xiamen Tungsten Co., Ltd. (600549SS) are evaluated in the market.
Contents of the Template
- Pre-Filled Data: Contains historical financial information and forecasts for Xiamen Tungsten Co., Ltd. (600549SS).
- Discounted Cash Flow Model: An editable DCF valuation model with automatic calculation features.
- Weighted Average Cost of Capital (WACC): A dedicated worksheet for computing WACC using customized inputs.
- Key Financial Ratios: Assess the profitability, efficiency, and leverage of Xiamen Tungsten Co., Ltd. (600549SS).
- Customizable Inputs: Easily adjust revenue growth, profit margins, and tax rates.
- Clear Dashboard: Visual representations and tables that summarize key valuation outcomes.
Disclaimer
All information, articles, and product details provided on this website are for general informational and educational purposes only. We do not claim any ownership over, nor do we intend to infringe upon, any trademarks, copyrights, logos, brand names, or other intellectual property mentioned or depicted on this site. Such intellectual property remains the property of its respective owners, and any references here are made solely for identification or informational purposes, without implying any affiliation, endorsement, or partnership.
We make no representations or warranties, express or implied, regarding the accuracy, completeness, or suitability of any content or products presented. Nothing on this website should be construed as legal, tax, investment, financial, medical, or other professional advice. In addition, no part of this site—including articles or product references—constitutes a solicitation, recommendation, endorsement, advertisement, or offer to buy or sell any securities, franchises, or other financial instruments, particularly in jurisdictions where such activity would be unlawful.
All content is of a general nature and may not address the specific circumstances of any individual or entity. It is not a substitute for professional advice or services. Any actions you take based on the information provided here are strictly at your own risk. You accept full responsibility for any decisions or outcomes arising from your use of this website and agree to release us from any liability in connection with your use of, or reliance upon, the content or products found herein.