
|
Glarun Technology Co., Ltd (600562.SS) Avaliação DCF |
Totalmente Editável: Adapte-Se Às Suas Necessidades No Excel Ou Planilhas
Design Profissional: Modelos Confiáveis E Padrão Da Indústria
Pré-Construídos Para Uso Rápido E Eficiente
Compatível com MAC/PC, totalmente desbloqueado
Não É Necessária Experiência; Fácil De Seguir
Glarun Technology Co.,Ltd (600562.SS) Bundle
Projetado para precisão, nossa calculadora DCF (600562SS) o capacita a avaliar a avaliação da Glarun Technology Co., LTD usando dados financeiros do mundo real, oferecendo flexibilidade completa para modificar todos os parâmetros essenciais para projeções aprimoradas.
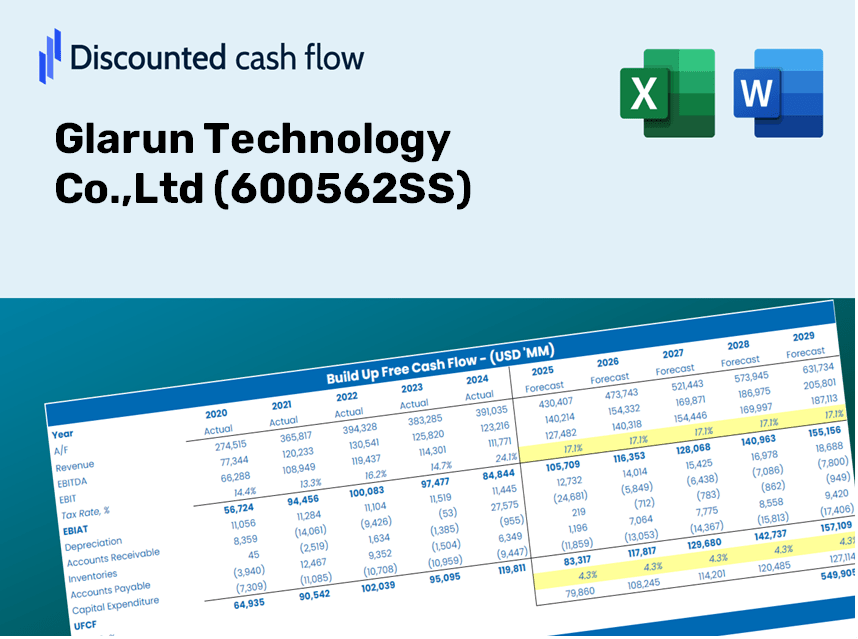
Discounted Cash Flow (DCF) - (USD MM)
| Year | AY1 2020 |
AY2 2021 |
AY3 2022 |
AY4 2023 |
AY5 2024 |
FY1 2025 |
FY2 2026 |
FY3 2027 |
FY4 2028 |
FY5 2029 |
|---|---|---|---|---|---|---|---|---|---|---|
| Revenue | 3,605.5 | 3,432.2 | 3,224.9 | 3,282.1 | 3,400.4 | 3,354.0 | 3,308.1 | 3,262.9 | 3,218.3 | 3,174.3 |
| Revenue Growth, % | 0 | -4.81 | -6.04 | 1.77 | 3.61 | -1.37 | -1.37 | -1.37 | -1.37 | -1.37 |
| EBITDA | 613.8 | 570.2 | 609.9 | 697.1 | 716.3 | 636.3 | 627.6 | 619.0 | 610.5 | 602.2 |
| EBITDA, % | 17.02 | 16.61 | 18.91 | 21.24 | 21.07 | 18.97 | 18.97 | 18.97 | 18.97 | 18.97 |
| Depreciation | 49.3 | 46.6 | 43.7 | 44.4 | 40.8 | 44.5 | 43.9 | 43.3 | 42.7 | 42.1 |
| Depreciation, % | 1.37 | 1.36 | 1.36 | 1.35 | 1.2 | 1.33 | 1.33 | 1.33 | 1.33 | 1.33 |
| EBIT | 564.5 | 523.6 | 566.2 | 652.7 | 675.5 | 591.8 | 583.7 | 575.7 | 567.8 | 560.1 |
| EBIT, % | 15.66 | 15.26 | 17.56 | 19.89 | 19.86 | 17.64 | 17.64 | 17.64 | 17.64 | 17.64 |
| Total Cash | 1,170.9 | 1,169.6 | 1,094.7 | 1,563.5 | 1,130.3 | 1,216.6 | 1,200.0 | 1,183.6 | 1,167.4 | 1,151.5 |
| Total Cash, percent | .0 | .0 | .0 | .0 | .0 | .0 | .0 | .0 | .0 | .0 |
| Account Receivables | 3,347.2 | 2,645.4 | 3,675.7 | 2,999.7 | 5,150.7 | 3,094.4 | 3,052.1 | 3,010.4 | 2,969.2 | 2,928.6 |
| Account Receivables, % | 92.83 | 77.08 | 113.98 | 91.4 | 151.47 | 92.26 | 92.26 | 92.26 | 92.26 | 92.26 |
| Inventories | 2,086.0 | 2,178.2 | 2,003.2 | 2,079.5 | 1,779.9 | 2,006.6 | 1,979.2 | 1,952.1 | 1,925.4 | 1,899.1 |
| Inventories, % | 57.86 | 63.47 | 62.12 | 63.36 | 52.34 | 59.83 | 59.83 | 59.83 | 59.83 | 59.83 |
| Accounts Payable | 2,619.2 | 1,437.4 | 2,131.6 | 2,497.2 | 2,273.3 | 2,170.4 | 2,140.7 | 2,111.5 | 2,082.6 | 2,054.1 |
| Accounts Payable, % | 72.64 | 41.88 | 66.1 | 76.09 | 66.85 | 64.71 | 64.71 | 64.71 | 64.71 | 64.71 |
| Capital Expenditure | -25.5 | -25.5 | -42.5 | -36.6 | -30.4 | -32.0 | -31.6 | -31.2 | -30.7 | -30.3 |
| Capital Expenditure, % | -0.70775 | -0.74208 | -1.32 | -1.12 | -0.89362 | -0.95525 | -0.95525 | -0.95525 | -0.95525 | -0.95525 |
| Tax Rate, % | 12.51 | 12.51 | 12.51 | 12.51 | 12.51 | 12.51 | 12.51 | 12.51 | 12.51 | 12.51 |
| EBITAT | 455.9 | 460.0 | 498.3 | 570.5 | 591.0 | 510.7 | 503.7 | 496.9 | 490.1 | 483.4 |
| Depreciation | ||||||||||
| Changes in Account Receivables | ||||||||||
| Changes in Inventories | ||||||||||
| Changes in Accounts Payable | ||||||||||
| Capital Expenditure | ||||||||||
| UFCF | -2,334.4 | -91.0 | 338.5 | 1,543.7 | -1,473.9 | 2,249.9 | 556.1 | 548.5 | 541.0 | 533.6 |
| WACC, % | 6.92 | 6.93 | 6.93 | 6.93 | 6.93 | 6.92 | 6.92 | 6.92 | 6.92 | 6.92 |
| PV UFCF | ||||||||||
| SUM PV UFCF | 3,835.0 | |||||||||
| Long Term Growth Rate, % | 3.50 | |||||||||
| Free cash flow (T + 1) | 552 | |||||||||
| Terminal Value | 16,125 | |||||||||
| Present Terminal Value | 11,537 | |||||||||
| Enterprise Value | 15,372 | |||||||||
| Net Debt | -930 | |||||||||
| Equity Value | 16,302 | |||||||||
| Diluted Shares Outstanding, MM | 1,235 | |||||||||
| Equity Value Per Share | 13.20 |
What You Will Receive
- Authentic Glarun Technology Financial Data: Pre-loaded with the historical and projected data of Glarun Technology for accurate analysis.
- Completely Customizable Template: Easily adjust essential inputs such as revenue growth, WACC, and EBITDA %.
- Instant Calculations: Watch Glarun Technology's intrinsic value update in real-time as you modify inputs.
- Professional Valuation Tool: Tailored for investors, analysts, and consultants in pursuit of precise DCF outcomes.
- User-Friendly Interface: Designed for simplicity, featuring a clear layout and straightforward instructions suitable for all levels of expertise.
Key Features
- Comprehensive Glarun Data: Pre-loaded with Glarun Technology Co., Ltd's historical performance metrics and future projections.
- Fully Adjustable Parameters: Tailor revenue growth, profit margins, WACC, tax rates, and capital expenditures to your needs.
- Interactive Valuation Model: Automatically recalculates Net Present Value (NPV) and intrinsic value as you modify inputs.
- Scenario Analysis: Generate various forecasting scenarios to explore different valuation results.
- Intuitive Interface: Designed for both experts and newcomers, offering a clear and organized layout.
How It Works
- Step 1: Download the prebuilt Excel template featuring Glarun Technology Co., Ltd's (600562SS) data.
- Step 2: Review the pre-filled sheets to grasp the essential metrics.
- Step 3: Modify forecasts and assumptions in the editable yellow cells (WACC, growth, margins).
- Step 4: Instantly see the updated results, including Glarun Technology Co., Ltd’s (600562SS) intrinsic value.
- Step 5: Use the outputs to make well-informed investment decisions or create reports.
Why Choose Glarun Technology Co.,Ltd (600562SS) Calculator?
- Designed for Experts: A sophisticated tool utilized by analysts, CFOs, and industry consultants.
- Accurate Financial Data: Glarun's historical and forecasted financial information is integrated for precision.
- Flexible Scenario Analysis: Effortlessly simulate various forecasts and assumptions.
- Intuitive Outputs: Automatically computes intrinsic value, NPV, and essential metrics.
- User-Friendly Interface: Comprehensive step-by-step guidance to navigate the tool.
Who Can Benefit from This Product?
- Investors: Accurately evaluate Glarun Technology Co., Ltd’s (600562SS) fair value prior to making investment choices.
- CFOs: Utilize a professional-grade DCF model for precise financial reporting and analysis.
- Consultants: Easily customize the template for valuation reports tailored to client needs.
- Entrepreneurs: Acquire insights into the financial modeling practices of Fortune 500 companies.
- Educators: Employ it as a valuable teaching resource to illustrate various valuation methodologies.
Contents of the Template
- Preloaded Glarun Technology Data: Historical and projected financial information, including revenue, EBIT, and capital expenditures.
- DCF and WACC Models: Professional-grade spreadsheets designed for calculating intrinsic value and Weighted Average Cost of Capital.
- Editable Inputs: Cells highlighted in yellow for modifying revenue growth, tax rates, and discount rates.
- Financial Statements: Detailed annual and quarterly financial data for in-depth analysis.
- Key Ratios: Ratios for profitability, leverage, and efficiency to assess performance.
- Dashboard and Charts: Visual representations of valuation results and underlying assumptions.
Disclaimer
All information, articles, and product details provided on this website are for general informational and educational purposes only. We do not claim any ownership over, nor do we intend to infringe upon, any trademarks, copyrights, logos, brand names, or other intellectual property mentioned or depicted on this site. Such intellectual property remains the property of its respective owners, and any references here are made solely for identification or informational purposes, without implying any affiliation, endorsement, or partnership.
We make no representations or warranties, express or implied, regarding the accuracy, completeness, or suitability of any content or products presented. Nothing on this website should be construed as legal, tax, investment, financial, medical, or other professional advice. In addition, no part of this site—including articles or product references—constitutes a solicitation, recommendation, endorsement, advertisement, or offer to buy or sell any securities, franchises, or other financial instruments, particularly in jurisdictions where such activity would be unlawful.
All content is of a general nature and may not address the specific circumstances of any individual or entity. It is not a substitute for professional advice or services. Any actions you take based on the information provided here are strictly at your own risk. You accept full responsibility for any decisions or outcomes arising from your use of this website and agree to release us from any liability in connection with your use of, or reliance upon, the content or products found herein.