
|
Xiamen Faratronic Co., Ltd. (600563.SS) Avaliação DCF |
Totalmente Editável: Adapte-Se Às Suas Necessidades No Excel Ou Planilhas
Design Profissional: Modelos Confiáveis E Padrão Da Indústria
Pré-Construídos Para Uso Rápido E Eficiente
Compatível com MAC/PC, totalmente desbloqueado
Não É Necessária Experiência; Fácil De Seguir
Xiamen Faratronic Co., Ltd. (600563.SS) Bundle
Simplifique a avaliação Xiamen Faratronic Co., Ltd. (600563Ss) com esta calculadora DCF personalizável! Apresentando a Xiamen Faratronic Co., Ltd. (600563Ss) e insumos de previsão ajustáveis, você pode testar cenários e descobrir o valor justo Xiamen Faratronic Co., Ltd. (600563S) em minutos.
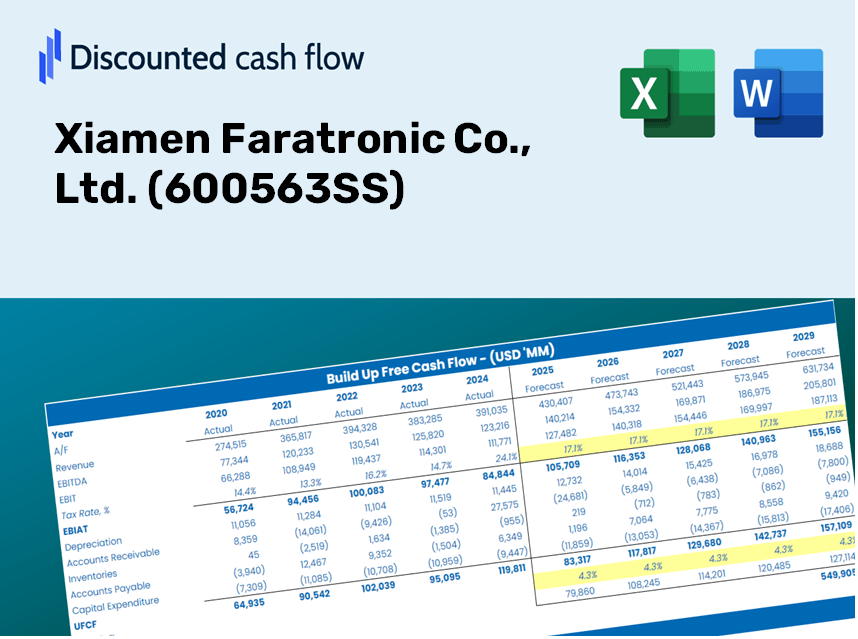
Discounted Cash Flow (DCF) - (USD MM)
| Year | AY1 2020 |
AY2 2021 |
AY3 2022 |
AY4 2023 |
AY5 2024 |
FY1 2025 |
FY2 2026 |
FY3 2027 |
FY4 2028 |
FY5 2029 |
|---|---|---|---|---|---|---|---|---|---|---|
| Revenue | 1,890.6 | 2,810.6 | 3,836.2 | 3,879.8 | 4,771.8 | 6,075.4 | 7,735.2 | 9,848.5 | 12,539.1 | 15,964.8 |
| Revenue Growth, % | 0 | 48.66 | 36.49 | 1.14 | 22.99 | 27.32 | 27.32 | 27.32 | 27.32 | 27.32 |
| EBITDA | 654.0 | 944.3 | 1,198.2 | 1,289.9 | 1,356.2 | 1,957.4 | 2,492.2 | 3,173.1 | 4,040.0 | 5,143.7 |
| EBITDA, % | 34.6 | 33.6 | 31.23 | 33.25 | 28.42 | 32.22 | 32.22 | 32.22 | 32.22 | 32.22 |
| Depreciation | 72.8 | 90.4 | 130.7 | 172.3 | 206.5 | 233.8 | 297.7 | 379.1 | 482.6 | 614.5 |
| Depreciation, % | 3.85 | 3.22 | 3.41 | 4.44 | 4.33 | 3.85 | 3.85 | 3.85 | 3.85 | 3.85 |
| EBIT | 581.2 | 853.9 | 1,067.5 | 1,117.5 | 1,149.8 | 1,723.6 | 2,194.5 | 2,794.0 | 3,557.4 | 4,529.2 |
| EBIT, % | 30.74 | 30.38 | 27.83 | 28.8 | 24.09 | 28.37 | 28.37 | 28.37 | 28.37 | 28.37 |
| Total Cash | 1,369.2 | 1,801.1 | 1,902.9 | 1,105.3 | 1,301.9 | 2,939.1 | 3,742.0 | 4,764.3 | 6,065.9 | 7,723.2 |
| Total Cash, percent | .0 | .0 | .0 | .0 | .0 | .0 | .0 | .0 | .0 | .0 |
| Account Receivables | 1,090.7 | 1,144.3 | 1,553.1 | 1,648.6 | 2,280.8 | 2,784.7 | 3,545.5 | 4,514.1 | 5,747.4 | 7,317.6 |
| Account Receivables, % | 57.69 | 40.72 | 40.48 | 42.49 | 47.8 | 45.84 | 45.84 | 45.84 | 45.84 | 45.84 |
| Inventories | 363.3 | 588.0 | 729.5 | 671.2 | 802.7 | 1,133.4 | 1,443.0 | 1,837.3 | 2,339.2 | 2,978.3 |
| Inventories, % | 19.22 | 20.92 | 19.02 | 17.3 | 16.82 | 18.66 | 18.66 | 18.66 | 18.66 | 18.66 |
| Accounts Payable | 474.7 | 828.4 | 1,133.4 | 1,139.4 | 2,009.9 | 1,890.8 | 2,407.4 | 3,065.1 | 3,902.5 | 4,968.6 |
| Accounts Payable, % | 25.11 | 29.47 | 29.54 | 29.37 | 42.12 | 31.12 | 31.12 | 31.12 | 31.12 | 31.12 |
| Capital Expenditure | -131.6 | -302.9 | -584.4 | -472.6 | -390.5 | -648.1 | -825.2 | -1,050.6 | -1,337.7 | -1,703.1 |
| Capital Expenditure, % | -6.96 | -10.78 | -15.23 | -12.18 | -8.18 | -10.67 | -10.67 | -10.67 | -10.67 | -10.67 |
| Tax Rate, % | 13.45 | 13.45 | 13.45 | 13.45 | 13.45 | 13.45 | 13.45 | 13.45 | 13.45 | 13.45 |
| EBITAT | 491.8 | 725.6 | 931.1 | 965.6 | 995.1 | 1,481.5 | 1,886.3 | 2,401.6 | 3,057.7 | 3,893.1 |
| Depreciation | ||||||||||
| Changes in Account Receivables | ||||||||||
| Changes in Inventories | ||||||||||
| Changes in Accounts Payable | ||||||||||
| Capital Expenditure | ||||||||||
| UFCF | -546.3 | 588.4 | 232.2 | 634.0 | 917.8 | 113.6 | 804.9 | 1,024.8 | 1,304.8 | 1,661.3 |
| WACC, % | 4.57 | 4.57 | 4.57 | 4.57 | 4.57 | 4.57 | 4.57 | 4.57 | 4.57 | 4.57 |
| PV UFCF | ||||||||||
| SUM PV UFCF | 4,160.9 | |||||||||
| Long Term Growth Rate, % | 3.00 | |||||||||
| Free cash flow (T + 1) | 1,711 | |||||||||
| Terminal Value | 108,953 | |||||||||
| Present Terminal Value | 87,135 | |||||||||
| Enterprise Value | 91,296 | |||||||||
| Net Debt | -302 | |||||||||
| Equity Value | 91,598 | |||||||||
| Diluted Shares Outstanding, MM | 225 | |||||||||
| Equity Value Per Share | 407.10 |
Benefits of Choosing Xiamen Faratronic Co., Ltd. (600563SS)
- Genuine Financial Data: Access both historical and projected figures for precise valuation.
- Customizable Inputs: Adjust WACC, tax rates, revenue growth, and capital investment parameters.
- Automatic Calculations: Intrinsic value and NPV are computed in real time.
- Scenario Analysis: Evaluate various scenarios to assess Xiamen Faratronic’s future potential.
- User-Friendly Design: Engineered for professionals while remaining approachable for newcomers.
Key Features
- Comprehensive Historical Data: Pre-loaded with Xiamen Faratronic Co., Ltd.'s (600563SS) past financial performance and future forecasts.
- Fully Adjustable Parameters: Tailor revenue growth rates, profit margins, discount rates, tax percentages, and capital expenditures as per your analysis.
- Interactive Valuation Model: Real-time updates to Net Present Value (NPV) and intrinsic value aligned with your customized inputs.
- Multi-Scenario Analysis: Generate various forecasting scenarios to evaluate different valuation results.
- Intuitive User Interface: Designed for ease of use, making it accessible for both experienced professionals and newcomers.
How It Works
- Step 1: Download the prebuilt Excel template featuring Xiamen Faratronic Co., Ltd. (600563SS) data.
- Step 2: Review the pre-filled worksheets to grasp the essential metrics.
- Step 3: Modify forecasts and assumptions in the editable yellow cells (WACC, growth, margins).
- Step 4: Instantly access updated results, including the intrinsic value of Xiamen Faratronic Co., Ltd. (600563SS).
- Step 5: Utilize the outputs to make well-informed investment choices or create comprehensive reports.
Why Opt for Xiamen Faratronic Co., Ltd. [600563SS] Calculator?
- All-in-One Solution: Combines DCF, WACC, and financial ratio evaluations into a single tool.
- Flexible Inputs: Modify the highlighted cells to explore different scenarios tailored to your needs.
- In-Depth Analysis: Automatically determines Xiamen Faratronic's intrinsic value and Net Present Value.
- Built-In Data: Features historical and projected data for reliable baseline assessments.
- High-Quality Standard: Perfect for financial analysts, investors, and business advisors.
Who Can Benefit from Our Solutions?
- Electronics Engineering Students: Master circuit design principles and apply them to real-world scenarios.
- Researchers: Utilize advanced models in your academic projects or studies related to electronic components.
- Investors: Evaluate your investment strategies by analyzing the performance of Xiamen Faratronic Co., Ltd. (600563SS).
- Industry Analysts: Enhance your analysis process with our pre-configured, adaptable models for electronic components.
- Entrepreneurs: Understand the market dynamics by exploring how major firms like Xiamen Faratronic Co., Ltd. (600563SS) operate.
What the Template Includes
- Historical Data: Comprehensive overview of Xiamen Faratronic Co., Ltd.'s past financial performance and baseline projections.
- DCF and Levered DCF Models: In-depth templates for determining the intrinsic value of Xiamen Faratronic Co., Ltd. (600563SS).
- WACC Sheet: Pre-established calculations for Weighted Average Cost of Capital.
- Editable Inputs: Customize essential metrics such as growth rates, EBITDA %, and CAPEX assumptions.
- Quarterly and Annual Statements: Detailed analysis of Xiamen Faratronic Co., Ltd. (600563SS) financials.
- Interactive Dashboard: Dynamic visualization of valuation outcomes and forecasts.
Disclaimer
All information, articles, and product details provided on this website are for general informational and educational purposes only. We do not claim any ownership over, nor do we intend to infringe upon, any trademarks, copyrights, logos, brand names, or other intellectual property mentioned or depicted on this site. Such intellectual property remains the property of its respective owners, and any references here are made solely for identification or informational purposes, without implying any affiliation, endorsement, or partnership.
We make no representations or warranties, express or implied, regarding the accuracy, completeness, or suitability of any content or products presented. Nothing on this website should be construed as legal, tax, investment, financial, medical, or other professional advice. In addition, no part of this site—including articles or product references—constitutes a solicitation, recommendation, endorsement, advertisement, or offer to buy or sell any securities, franchises, or other financial instruments, particularly in jurisdictions where such activity would be unlawful.
All content is of a general nature and may not address the specific circumstances of any individual or entity. It is not a substitute for professional advice or services. Any actions you take based on the information provided here are strictly at your own risk. You accept full responsibility for any decisions or outcomes arising from your use of this website and agree to release us from any liability in connection with your use of, or reliance upon, the content or products found herein.