
|
Hubei Jumpcan Pharmaceutical Co., Ltd. (600566.SS) Avaliação DCF |
Totalmente Editável: Adapte-Se Às Suas Necessidades No Excel Ou Planilhas
Design Profissional: Modelos Confiáveis E Padrão Da Indústria
Pré-Construídos Para Uso Rápido E Eficiente
Compatível com MAC/PC, totalmente desbloqueado
Não É Necessária Experiência; Fácil De Seguir
Hubei Jumpcan Pharmaceutical Co., Ltd. (600566.SS) Bundle
Atualize sua análise e melhore a precisão com a calculadora DCF (600566SS)! Utilizando o Hubei Jumpcan Pharmaceutical Co., Ltd. Dados e suposições personalizáveis, essa ferramenta capacita você a prever, analisar e valorizar o Hubei Jumpcan como um investidor experiente.
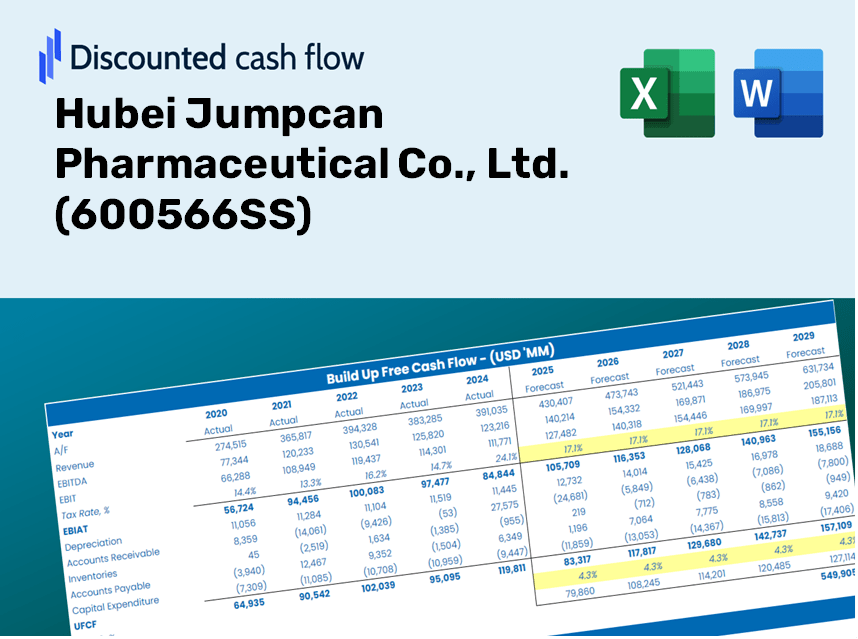
Discounted Cash Flow (DCF) - (USD MM)
| Year | AY1 2020 |
AY2 2021 |
AY3 2022 |
AY4 2023 |
AY5 2024 |
FY1 2025 |
FY2 2026 |
FY3 2027 |
FY4 2028 |
FY5 2029 |
|---|---|---|---|---|---|---|---|---|---|---|
| Revenue | 6,165.0 | 7,630.5 | 8,996.4 | 9,654.5 | 8,016.9 | 8,658.8 | 9,352.0 | 10,100.8 | 10,909.5 | 11,782.9 |
| Revenue Growth, % | 0 | 23.77 | 17.9 | 7.32 | -16.96 | 8.01 | 8.01 | 8.01 | 8.01 | 8.01 |
| EBITDA | 1,666.2 | 1,963.7 | 2,561.0 | 3,184.8 | 2,726.8 | 2,567.0 | 2,772.5 | 2,994.4 | 3,234.2 | 3,493.1 |
| EBITDA, % | 27.03 | 25.73 | 28.47 | 32.99 | 34.01 | 29.65 | 29.65 | 29.65 | 29.65 | 29.65 |
| Depreciation | 281.0 | 293.1 | 307.1 | 301.2 | 301.1 | 323.6 | 349.5 | 377.5 | 407.8 | 440.4 |
| Depreciation, % | 4.56 | 3.84 | 3.41 | 3.12 | 3.76 | 3.74 | 3.74 | 3.74 | 3.74 | 3.74 |
| EBIT | 1,385.2 | 1,670.6 | 2,253.9 | 2,883.6 | 2,425.7 | 2,243.3 | 2,422.9 | 2,616.9 | 2,826.4 | 3,052.7 |
| EBIT, % | 22.47 | 21.89 | 25.05 | 29.87 | 30.26 | 25.91 | 25.91 | 25.91 | 25.91 | 25.91 |
| Total Cash | 4,217.1 | 5,494.0 | 7,863.5 | 10,916.3 | 11,830.3 | 7,408.7 | 8,001.8 | 8,642.5 | 9,334.4 | 10,081.8 |
| Total Cash, percent | .0 | .0 | .0 | .0 | .0 | .0 | .0 | .0 | .0 | .0 |
| Account Receivables | 2,051.7 | 2,194.9 | 2,867.5 | 2,803.5 | 2,270.0 | 2,619.6 | 2,829.4 | 3,055.9 | 3,300.6 | 3,564.8 |
| Account Receivables, % | 33.28 | 28.76 | 31.87 | 29.04 | 28.32 | 30.25 | 30.25 | 30.25 | 30.25 | 30.25 |
| Inventories | 278.4 | 375.6 | 391.5 | 490.1 | 569.1 | 449.6 | 485.6 | 524.5 | 566.5 | 611.9 |
| Inventories, % | 4.52 | 4.92 | 4.35 | 5.08 | 7.1 | 5.19 | 5.19 | 5.19 | 5.19 | 5.19 |
| Accounts Payable | 657.8 | 945.8 | 38.9 | 2,140.8 | 1,730.2 | 1,164.6 | 1,257.9 | 1,358.6 | 1,467.4 | 1,584.9 |
| Accounts Payable, % | 10.67 | 12.39 | 0.43216 | 22.17 | 21.58 | 13.45 | 13.45 | 13.45 | 13.45 | 13.45 |
| Capital Expenditure | -429.6 | -248.3 | -243.7 | -301.6 | -174.3 | -315.7 | -341.0 | -368.3 | -397.8 | -429.6 |
| Capital Expenditure, % | -6.97 | -3.25 | -2.71 | -3.12 | -2.17 | -3.65 | -3.65 | -3.65 | -3.65 | -3.65 |
| Tax Rate, % | 15 | 15 | 15 | 15 | 15 | 15 | 15 | 15 | 15 | 15 |
| EBITAT | 1,192.6 | 1,472.5 | 1,950.8 | 2,468.8 | 2,061.9 | 1,935.6 | 2,090.5 | 2,257.9 | 2,438.7 | 2,634.0 |
| Depreciation | ||||||||||
| Changes in Account Receivables | ||||||||||
| Changes in Inventories | ||||||||||
| Changes in Accounts Payable | ||||||||||
| Capital Expenditure | ||||||||||
| UFCF | -628.4 | 1,564.9 | 418.9 | 4,535.7 | 2,232.5 | 1,147.8 | 1,946.6 | 2,102.5 | 2,270.8 | 2,452.6 |
| WACC, % | 4.61 | 4.61 | 4.61 | 4.61 | 4.6 | 4.61 | 4.61 | 4.61 | 4.61 | 4.61 |
| PV UFCF | ||||||||||
| SUM PV UFCF | 8,567.7 | |||||||||
| Long Term Growth Rate, % | 1.00 | |||||||||
| Free cash flow (T + 1) | 2,477 | |||||||||
| Terminal Value | 68,698 | |||||||||
| Present Terminal Value | 54,849 | |||||||||
| Enterprise Value | 63,416 | |||||||||
| Net Debt | -5,881 | |||||||||
| Equity Value | 69,297 | |||||||||
| Diluted Shares Outstanding, MM | 917 | |||||||||
| Equity Value Per Share | 75.55 |
Benefits You Will Receive
- Comprehensive Financial Model: Leverage Hubei Jumpcan Pharmaceutical's (600566SS) actual data for accurate DCF valuation.
- Complete Forecasting Control: Tailor revenue growth, profit margins, WACC, and other vital factors to your needs.
- Real-Time Calculations: Automatic updates provide immediate feedback as you adjust inputs.
- Professional Presentation Template: A polished Excel file crafted for high-quality valuation assessments.
- Flexible and Reusable: Designed for adaptability, allowing for frequent use in detailed forecasting projects.
Key Features
- Customizable Financial Inputs: Adjust essential parameters such as sales growth, profit margins, and investment expenditures.
- Instant DCF Valuation: Quickly computes intrinsic value, net present value (NPV), and additional financial metrics.
- High Precision Valuations: Based on Hubei Jumpcan Pharmaceutical Co., Ltd.’s real performance data for accurate valuation results.
- Simplified Scenario Planning: Easily experiment with various assumptions and evaluate different outcomes.
- Efficiency Booster: Avoid the hassle of creating intricate valuation models from the ground up.
How It Operates
- 1. Access the Template: Download and open the Excel file featuring Hubei Jumpcan Pharmaceutical Co., Ltd.’s (600566SS) preloaded data.
- 2. Modify Assumptions: Adjust essential inputs such as growth rates, WACC, and capital expenditures.
- 3. Instant Result Visualization: The DCF model automatically computes intrinsic value and NPV.
- 4. Explore Scenarios: Evaluate multiple forecasts to examine various valuation outcomes.
- 5. Present Confidently: Deliver professional valuation insights to bolster your decision-making.
Why Choose This Calculator for Hubei Jumpcan Pharmaceutical Co., Ltd. (600566SS)?
- Designed for Experts: A specialized tool favored by analysts, CFOs, and industry consultants.
- Comprehensive Data: Hubei Jumpcan's historical and forecasted financial information is preloaded for enhanced accuracy.
- Flexible Scenario Analysis: Effortlessly test various financial scenarios and assumptions.
- Transparent Results: Automatically computes intrinsic value, NPV, and essential metrics.
- User-Friendly: Clear, step-by-step guidance to help you navigate the calculations.
Who Can Benefit from Hubei Jumpcan Pharmaceutical Co., Ltd. (600566SS)?
- Investors: Make informed investment choices with our expert-level financial analysis tools.
- Financial Analysts: Streamline your workflow with customizable financial models designed for efficiency.
- Consultants: Easily tailor our resources for impactful client presentations and comprehensive reports.
- Pharmaceutical Enthusiasts: Enhance your knowledge of industry trends and valuation methods with practical case studies.
- Educators and Students: Utilize our materials as a hands-on learning resource in pharmaceutical finance courses.
Contents of the Template
- Operating and Balance Sheet Data: Pre-filled historical data and forecasts for Hubei Jumpcan Pharmaceutical Co., Ltd. (600566SS), including revenue, EBITDA, EBIT, and capital expenditures.
- WACC Calculation: A dedicated sheet for Weighted Average Cost of Capital (WACC), featuring parameters such as Beta, risk-free rate, and share price.
- DCF Valuation (Unlevered and Levered): Customizable Discounted Cash Flow models displaying intrinsic value with comprehensive calculations.
- Financial Statements: Pre-loaded financial statements (annual and quarterly) to aid in thorough analysis.
- Key Ratios: Includes profitability, leverage, and efficiency ratios specific to Hubei Jumpcan Pharmaceutical Co., Ltd. (600566SS).
- Dashboard and Charts: A visual overview of valuation outputs and assumptions, facilitating easy analysis of the results.
Disclaimer
All information, articles, and product details provided on this website are for general informational and educational purposes only. We do not claim any ownership over, nor do we intend to infringe upon, any trademarks, copyrights, logos, brand names, or other intellectual property mentioned or depicted on this site. Such intellectual property remains the property of its respective owners, and any references here are made solely for identification or informational purposes, without implying any affiliation, endorsement, or partnership.
We make no representations or warranties, express or implied, regarding the accuracy, completeness, or suitability of any content or products presented. Nothing on this website should be construed as legal, tax, investment, financial, medical, or other professional advice. In addition, no part of this site—including articles or product references—constitutes a solicitation, recommendation, endorsement, advertisement, or offer to buy or sell any securities, franchises, or other financial instruments, particularly in jurisdictions where such activity would be unlawful.
All content is of a general nature and may not address the specific circumstances of any individual or entity. It is not a substitute for professional advice or services. Any actions you take based on the information provided here are strictly at your own risk. You accept full responsibility for any decisions or outcomes arising from your use of this website and agree to release us from any liability in connection with your use of, or reliance upon, the content or products found herein.