
|
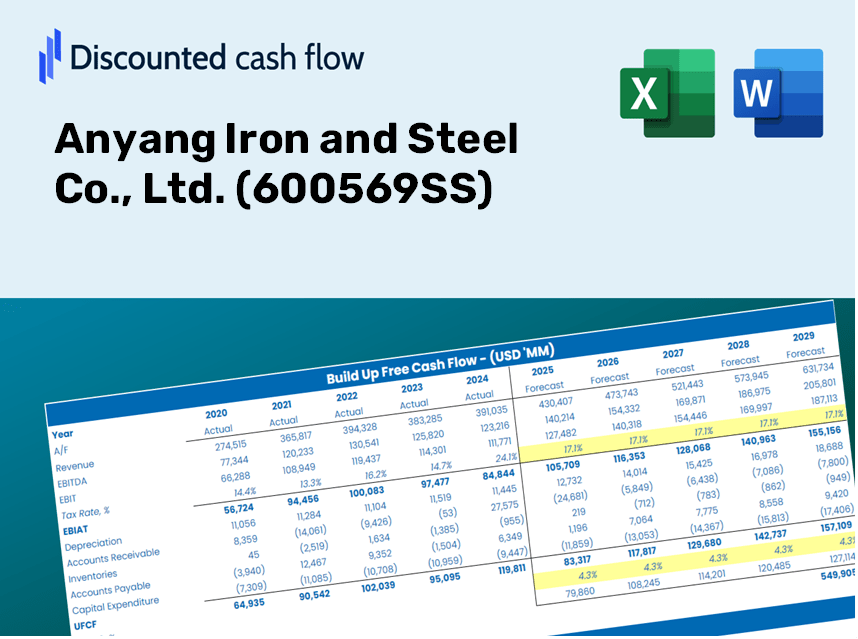
Anyang Iron and Steel Co., Ltd. (600569.Ss) Avaliação DCF |
Totalmente Editável: Adapte-Se Às Suas Necessidades No Excel Ou Planilhas
Design Profissional: Modelos Confiáveis E Padrão Da Indústria
Pré-Construídos Para Uso Rápido E Eficiente
Compatível com MAC/PC, totalmente desbloqueado
Não É Necessária Experiência; Fácil De Seguir
Anyang Iron and Steel Co., Ltd. (600569.SS) Bundle
Procurando determinar o valor intrínseco de Anyang Iron and Steel Co., Ltd.? Nossa calculadora DCF (600569SS) integra dados do mundo real com recursos abrangentes de personalização, permitindo refinar suas previsões e aprimorar suas opções de investimento.
What You Will Receive
- Comprehensive (600569SS) Financial Data: Access to both historical and projected figures for precise valuations.
- Customizable Parameters: Adjust key metrics such as WACC, tax rates, revenue growth, and capital expenditures to suit your analysis.
- Dynamic Calculations: Automatically compute intrinsic value and NPV in real-time.
- Scenario Planning: Explore various scenarios to assess the future performance of Anyang Iron and Steel Co., Ltd.
- User-Friendly Interface: Designed for industry experts while remaining easy to navigate for newcomers.
Key Features
- Pre-Loaded Data: Anyang Iron and Steel Co., Ltd.'s historical financial statements and pre-filled forecasts.
- Fully Adjustable Inputs: Modify WACC, tax rates, revenue growth, and EBITDA margins as needed.
- Instant Results: View the intrinsic value of Anyang Iron and Steel Co., Ltd. recalculating in real-time.
- Clear Visual Outputs: Dashboard charts illustrate valuation results and essential metrics.
- Built for Accuracy: A professional tool designed for analysts, investors, and finance professionals.
How It Works
- Step 1: Download the prebuilt Excel template containing Anyang Iron and Steel Co., Ltd.'s (600569SS) data.
- Step 2: Review the pre-filled sheets to familiarize yourself with the essential metrics.
- Step 3: Modify forecasts and assumptions in the editable yellow cells (WACC, growth, margins).
- Step 4: Instantly see the recalibrated results, including Anyang Iron and Steel Co., Ltd.'s (600569SS) intrinsic value.
- Step 5: Utilize the outputs to make informed investment decisions or generate comprehensive reports.
Why Choose This Calculator for Anyang Iron and Steel Co., Ltd. (600569SS)?
- All-in-One Solution: Integrates DCF, WACC, and financial ratio analyses tailored for the steel industry.
- Flexible Input Options: Modify yellow-highlighted fields to explore different scenarios and outcomes.
- In-Depth Analysis: Automatically computes the intrinsic value and Net Present Value for Anyang Iron and Steel.
- Preloaded Industry Data: Comes with historical and projected data for precise calculations.
- Professional Standard: Perfectly suited for financial analysts, investors, and consultants specializing in the steel sector.
Who Should Utilize This Product?
- Finance Students: Discover valuation methods and practice them with actual data.
- Academics: Integrate established models into your research or teaching materials.
- Investors: Validate your theories and assess valuation results for Anyang Iron and Steel Co., Ltd. (600569SS).
- Analysts: Enhance your efficiency with a ready-to-use, customizable DCF model.
- Small Business Owners: Understand the analysis of large public firms like Anyang Iron and Steel Co., Ltd. (600569SS).
What the Template Contains
- Comprehensive DCF Model: Editable template featuring in-depth valuation calculations.
- Real-World Data: Anyang Iron and Steel Co., Ltd.’s historical and projected financials preloaded for thorough analysis.
- Customizable Parameters: Modify WACC, growth rates, and tax assumptions to explore various scenarios.
- Financial Statements: Complete annual and quarterly financial breakdowns for enhanced insights.
- Key Ratios: Integrated analysis covering profitability, efficiency, and leverage metrics.
- Dashboard with Visual Outputs: Charts and tables that provide clear, actionable results.
Disclaimer
All information, articles, and product details provided on this website are for general informational and educational purposes only. We do not claim any ownership over, nor do we intend to infringe upon, any trademarks, copyrights, logos, brand names, or other intellectual property mentioned or depicted on this site. Such intellectual property remains the property of its respective owners, and any references here are made solely for identification or informational purposes, without implying any affiliation, endorsement, or partnership.
We make no representations or warranties, express or implied, regarding the accuracy, completeness, or suitability of any content or products presented. Nothing on this website should be construed as legal, tax, investment, financial, medical, or other professional advice. In addition, no part of this site—including articles or product references—constitutes a solicitation, recommendation, endorsement, advertisement, or offer to buy or sell any securities, franchises, or other financial instruments, particularly in jurisdictions where such activity would be unlawful.
All content is of a general nature and may not address the specific circumstances of any individual or entity. It is not a substitute for professional advice or services. Any actions you take based on the information provided here are strictly at your own risk. You accept full responsibility for any decisions or outcomes arising from your use of this website and agree to release us from any liability in connection with your use of, or reliance upon, the content or products found herein.