
|
Zhejiang Conba Pharmaceutical Co., Ltd. (600572.Ss) Avaliação do DCF |
Totalmente Editável: Adapte-Se Às Suas Necessidades No Excel Ou Planilhas
Design Profissional: Modelos Confiáveis E Padrão Da Indústria
Pré-Construídos Para Uso Rápido E Eficiente
Compatível com MAC/PC, totalmente desbloqueado
Não É Necessária Experiência; Fácil De Seguir
Zhejiang CONBA Pharmaceutical Co.,Ltd. (600572.SS) Bundle
Simplifique Zhejiang Conba Pharmaceutical Co., Ltd. Avaliação com esta calculadora DCF personalizável! Apresentando a Real Zhejiang Conba Pharmaceutical Co., Ltd. Financeiras e insumos de previsão ajustáveis, você pode testar cenários e descobrir Zhejiang Conba Pharmaceutical Co., Ltd. Valor justo em minutos.
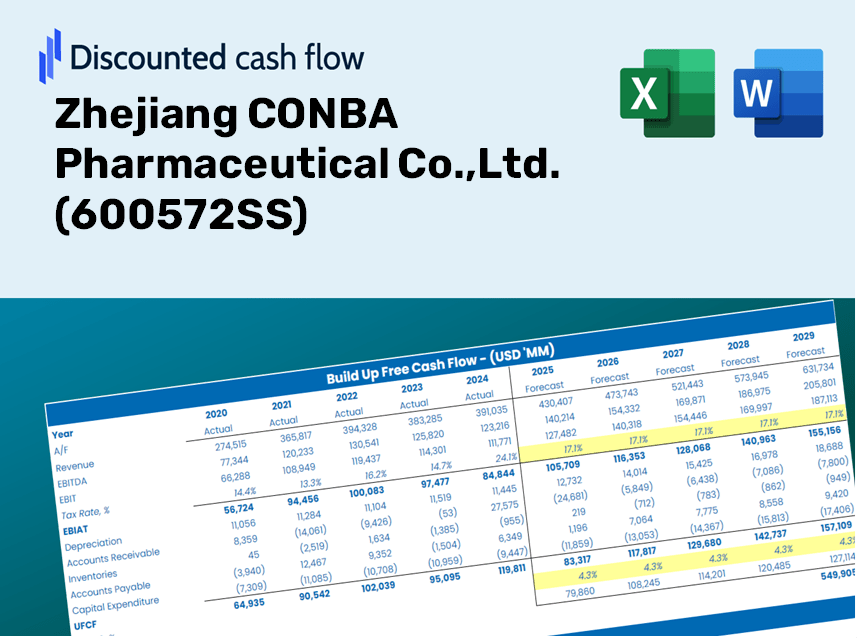
Discounted Cash Flow (DCF) - (USD MM)
| Year | AY1 2020 |
AY2 2021 |
AY3 2022 |
AY4 2023 |
AY5 2024 |
FY1 2025 |
FY2 2026 |
FY3 2027 |
FY4 2028 |
FY5 2029 |
|---|---|---|---|---|---|---|---|---|---|---|
| Revenue | 5,909.0 | 6,150.9 | 6,000.4 | 6,732.8 | 6,515.2 | 6,688.1 | 6,865.7 | 7,048.0 | 7,235.1 | 7,427.2 |
| Revenue Growth, % | 0 | 4.09 | -2.45 | 12.2 | -3.23 | 2.65 | 2.65 | 2.65 | 2.65 | 2.65 |
| EBITDA | 1,235.4 | 2,886.6 | 917.0 | 1,128.4 | 1,145.7 | 1,571.2 | 1,612.9 | 1,655.8 | 1,699.7 | 1,744.8 |
| EBITDA, % | 20.91 | 46.93 | 15.28 | 16.76 | 17.58 | 23.49 | 23.49 | 23.49 | 23.49 | 23.49 |
| Depreciation | 277.4 | 304.1 | 286.9 | 324.3 | 344.9 | 328.1 | 336.8 | 345.8 | 355.0 | 364.4 |
| Depreciation, % | 4.69 | 4.94 | 4.78 | 4.82 | 5.29 | 4.91 | 4.91 | 4.91 | 4.91 | 4.91 |
| EBIT | 958.0 | 2,582.5 | 630.1 | 804.1 | 800.7 | 1,243.1 | 1,276.1 | 1,310.0 | 1,344.7 | 1,380.4 |
| EBIT, % | 16.21 | 41.99 | 10.5 | 11.94 | 12.29 | 18.59 | 18.59 | 18.59 | 18.59 | 18.59 |
| Total Cash | 1,576.9 | 2,487.3 | 2,468.0 | 2,570.0 | 1,322.1 | 2,230.1 | 2,289.3 | 2,350.1 | 2,412.4 | 2,476.5 |
| Total Cash, percent | .0 | .0 | .0 | .0 | .0 | .0 | .0 | .0 | .0 | .0 |
| Account Receivables | 1,560.2 | 1,656.0 | 1,696.9 | 1,794.5 | 1,752.6 | 1,807.9 | 1,855.9 | 1,905.2 | 1,955.8 | 2,007.7 |
| Account Receivables, % | 26.4 | 26.92 | 28.28 | 26.65 | 26.9 | 27.03 | 27.03 | 27.03 | 27.03 | 27.03 |
| Inventories | 961.5 | 923.4 | 1,127.9 | 1,333.0 | 1,265.8 | 1,194.6 | 1,226.3 | 1,258.9 | 1,292.3 | 1,326.6 |
| Inventories, % | 16.27 | 15.01 | 18.8 | 19.8 | 19.43 | 17.86 | 17.86 | 17.86 | 17.86 | 17.86 |
| Accounts Payable | 353.7 | 630.9 | 629.1 | 819.5 | 984.4 | 722.4 | 741.6 | 761.3 | 781.5 | 802.3 |
| Accounts Payable, % | 5.99 | 10.26 | 10.48 | 12.17 | 15.11 | 10.8 | 10.8 | 10.8 | 10.8 | 10.8 |
| Capital Expenditure | -460.4 | -568.4 | -291.8 | -209.1 | -290.6 | -394.1 | -404.5 | -415.3 | -426.3 | -437.6 |
| Capital Expenditure, % | -7.79 | -9.24 | -4.86 | -3.11 | -4.46 | -5.89 | -5.89 | -5.89 | -5.89 | -5.89 |
| Tax Rate, % | 20.2 | 20.2 | 20.2 | 20.2 | 20.2 | 20.2 | 20.2 | 20.2 | 20.2 | 20.2 |
| EBITAT | 567.2 | 2,075.1 | 382.5 | 619.6 | 639.0 | 887.9 | 911.4 | 935.6 | 960.5 | 986.0 |
| Depreciation | ||||||||||
| Changes in Account Receivables | ||||||||||
| Changes in Inventories | ||||||||||
| Changes in Accounts Payable | ||||||||||
| Capital Expenditure | ||||||||||
| UFCF | -1,783.8 | 2,030.3 | 130.4 | 622.6 | 967.3 | 575.8 | 783.2 | 804.0 | 825.3 | 847.2 |
| WACC, % | 4.85 | 4.89 | 4.86 | 4.89 | 4.89 | 4.88 | 4.88 | 4.88 | 4.88 | 4.88 |
| PV UFCF | ||||||||||
| SUM PV UFCF | 3,308.0 | |||||||||
| Long Term Growth Rate, % | 3.50 | |||||||||
| Free cash flow (T + 1) | 877 | |||||||||
| Terminal Value | 63,710 | |||||||||
| Present Terminal Value | 50,213 | |||||||||
| Enterprise Value | 53,521 | |||||||||
| Net Debt | -992 | |||||||||
| Equity Value | 54,513 | |||||||||
| Diluted Shares Outstanding, MM | 2,490 | |||||||||
| Equity Value Per Share | 21.90 |
What You Will Receive
- Genuine CONBA Data: Preloaded financials – encompassing revenue to EBIT – derived from actual and projected figures for Zhejiang CONBA Pharmaceutical Co., Ltd. (600572SS).
- Complete Customization: Modify all essential parameters (highlighted cells) such as WACC, growth %, and tax rates to fit your analysis.
- Immediate Valuation Updates: Automatic recalculations that allow you to assess the effect of changes on the fair value of CONBA.
- Flexible Excel Template: Designed for easy modifications, scenario analysis, and in-depth projections.
- Efficiency and Precision: Eliminate the need to build models from the ground up while ensuring accuracy and adaptability.
Core Features
- Real-time Financial Data: Gain access to precise pre-loaded historical figures and future forecasts for Zhejiang CONBA Pharmaceutical Co., Ltd. (600572SS).
- Adjustable Forecast Parameters: Modify the highlighted fields, including WACC, growth rates, and profit margins, to suit your analysis.
- Real-time Calculations: Enjoy automatic updates for DCF, Net Present Value (NPV), and cash flow evaluations.
- Interactive Dashboard: Utilize clear charts and summaries for effective visualization of your valuation insights.
- Designed for All Users: An intuitive layout tailored for investors, CFOs, and consultants, accommodating both professionals and novices.
How It Operates
- Step 1: Download the Excel file.
- Step 2: Examine the pre-filled data for Zhejiang CONBA Pharmaceutical Co., Ltd. (600572SS) (historical and forecasted).
- Step 3: Modify key assumptions (highlighted in yellow) according to your analysis.
- Step 4: Observe the automatic updates for the intrinsic value of Zhejiang CONBA Pharmaceutical Co., Ltd. (600572SS).
- Step 5: Utilize the results for making investment choices or for reporting purposes.
Why Choose Zhejiang CONBA Pharmaceutical Co., Ltd. (600572SS) Calculator?
- Time-Saving: Skip the hassle of building a DCF model from scratch – it's ready for immediate use.
- Enhanced Accuracy: Dependable financial data and formulas minimize valuation errors.
- Fully Customizable: Adjust the model to align with your specific assumptions and forecasts.
- User-Friendly: Intuitive charts and outputs simplify data analysis.
- Endorsed by Professionals: Crafted for those who prioritize accuracy and ease of use.
Who Should Utilize This Product?
- Professional Investors: Develop comprehensive and accurate valuation models for analyzing investments in Zhejiang CONBA Pharmaceutical Co., Ltd. (600572SS).
- Corporate Finance Teams: Evaluate valuation scenarios to inform internal business strategies related to Zhejiang CONBA Pharmaceutical Co., Ltd. (600572SS).
- Consultants and Advisors: Offer clients reliable valuation assessments for Zhejiang CONBA Pharmaceutical Co., Ltd. (600572SS).
- Students and Educators: Apply real-world data to enhance understanding and instruction in financial modeling techniques.
- Pharmaceutical Industry Enthusiasts: Gain insights into how companies like Zhejiang CONBA Pharmaceutical Co., Ltd. (600572SS) are valued within the market.
What the Template Contains
- Preloaded CONBA Data: Historical and projected financial information, including revenue, EBIT, and capital expenditures.
- DCF and WACC Models: Professional-grade sheets designed for calculating intrinsic value and Weighted Average Cost of Capital.
- Editable Inputs: Yellow-highlighted cells that allow for adjustments to revenue growth, tax rates, and discount rates.
- Financial Statements: Detailed annual and quarterly financials for in-depth analysis.
- Key Ratios: Profitability, leverage, and efficiency ratios to assess performance.
- Dashboard and Charts: Visual summaries presenting valuation outcomes and underlying assumptions.
Disclaimer
All information, articles, and product details provided on this website are for general informational and educational purposes only. We do not claim any ownership over, nor do we intend to infringe upon, any trademarks, copyrights, logos, brand names, or other intellectual property mentioned or depicted on this site. Such intellectual property remains the property of its respective owners, and any references here are made solely for identification or informational purposes, without implying any affiliation, endorsement, or partnership.
We make no representations or warranties, express or implied, regarding the accuracy, completeness, or suitability of any content or products presented. Nothing on this website should be construed as legal, tax, investment, financial, medical, or other professional advice. In addition, no part of this site—including articles or product references—constitutes a solicitation, recommendation, endorsement, advertisement, or offer to buy or sell any securities, franchises, or other financial instruments, particularly in jurisdictions where such activity would be unlawful.
All content is of a general nature and may not address the specific circumstances of any individual or entity. It is not a substitute for professional advice or services. Any actions you take based on the information provided here are strictly at your own risk. You accept full responsibility for any decisions or outcomes arising from your use of this website and agree to release us from any liability in connection with your use of, or reliance upon, the content or products found herein.