
|
Pequim Jingneng Power Co., Ltd. (600578.SS) Avaliação DCF |
Totalmente Editável: Adapte-Se Às Suas Necessidades No Excel Ou Planilhas
Design Profissional: Modelos Confiáveis E Padrão Da Indústria
Pré-Construídos Para Uso Rápido E Eficiente
Compatível com MAC/PC, totalmente desbloqueado
Não É Necessária Experiência; Fácil De Seguir
Beijing Jingneng Power Co., Ltd. (600578.SS) Bundle
Procurando avaliar o valor intrínseco de Pequim Jingneng Power Co., Ltd.? Nossa calculadora (600578SS) integra dados do mundo real com extensas opções de personalização, permitindo ajustar as previsões e fazer escolhas de investimento mais informadas.
Discounted Cash Flow (DCF) - (USD MM)
| Year | AY1 2020 |
AY2 2021 |
AY3 2022 |
AY4 2023 |
AY5 2024 |
FY1 2025 |
FY2 2026 |
FY3 2027 |
FY4 2028 |
FY5 2029 |
|---|---|---|---|---|---|---|---|---|---|---|
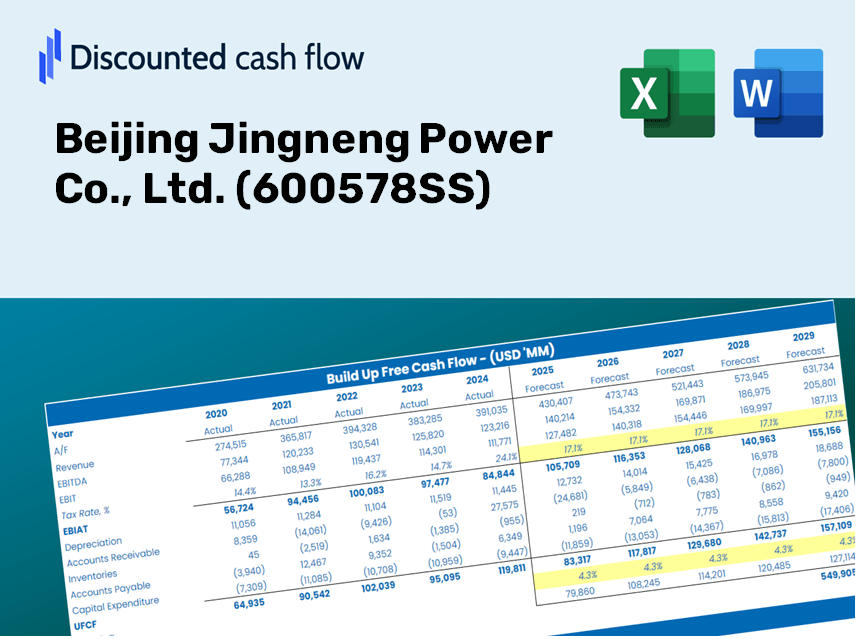
| Revenue | 20,097.5 | 22,240.0 | 30,485.4 | 33,253.5 | 35,428.0 | 41,039.4 | 47,539.4 | 55,069.1 | 63,791.3 | 73,894.9 |
| Revenue Growth, % | 0 | 10.66 | 37.07 | 9.08 | 6.54 | 15.84 | 15.84 | 15.84 | 15.84 | 15.84 |
| EBITDA | 5,570.6 | 70.4 | 4,832.5 | 5,259.1 | 6,398.8 | 6,382.7 | 7,393.6 | 8,564.6 | 9,921.1 | 11,492.5 |
| EBITDA, % | 27.72 | 0.31638 | 15.85 | 15.82 | 18.06 | 15.55 | 15.55 | 15.55 | 15.55 | 15.55 |
| Depreciation | 3,000.2 | 2,923.3 | 3,272.5 | 3,396.2 | 3,350.7 | 4,799.8 | 5,560.0 | 6,440.6 | 7,460.7 | 8,642.4 |
| Depreciation, % | 14.93 | 13.14 | 10.73 | 10.21 | 9.46 | 11.7 | 11.7 | 11.7 | 11.7 | 11.7 |
| EBIT | 2,570.4 | -2,852.9 | 1,560.0 | 1,862.9 | 3,048.1 | 1,582.9 | 1,833.6 | 2,124.0 | 2,460.4 | 2,850.1 |
| EBIT, % | 12.79 | -12.83 | 5.12 | 5.6 | 8.6 | 3.86 | 3.86 | 3.86 | 3.86 | 3.86 |
| Total Cash | 3,705.0 | 4,002.2 | 4,375.1 | 4,695.8 | 3,513.0 | 6,141.1 | 7,113.7 | 8,240.4 | 9,545.6 | 11,057.5 |
| Total Cash, percent | .0 | .0 | .0 | .0 | .0 | .0 | .0 | .0 | .0 | .0 |
| Account Receivables | 3,810.4 | 4,967.8 | 5,138.0 | 5,109.5 | 5,067.2 | 7,208.1 | 8,349.8 | 9,672.3 | 11,204.2 | 12,978.8 |
| Account Receivables, % | 18.96 | 22.34 | 16.85 | 15.37 | 14.3 | 17.56 | 17.56 | 17.56 | 17.56 | 17.56 |
| Inventories | 909.1 | 1,570.9 | 1,148.7 | 1,379.4 | 2,311.3 | 2,136.3 | 2,474.6 | 2,866.6 | 3,320.6 | 3,846.6 |
| Inventories, % | 4.52 | 7.06 | 3.77 | 4.15 | 6.52 | 5.21 | 5.21 | 5.21 | 5.21 | 5.21 |
| Accounts Payable | 6,250.2 | 7,278.9 | 4,971.9 | 5,375.7 | 7,853.7 | 9,723.9 | 11,264.1 | 13,048.1 | 15,114.8 | 17,508.8 |
| Accounts Payable, % | 31.1 | 32.73 | 16.31 | 16.17 | 22.17 | 23.69 | 23.69 | 23.69 | 23.69 | 23.69 |
| Capital Expenditure | -5,212.9 | -4,857.3 | -4,565.2 | -6,037.6 | -4,851.7 | -7,765.0 | -8,994.9 | -10,419.5 | -12,069.9 | -13,981.6 |
| Capital Expenditure, % | -25.94 | -21.84 | -14.98 | -18.16 | -13.69 | -18.92 | -18.92 | -18.92 | -18.92 | -18.92 |
| Tax Rate, % | 26.96 | 26.96 | 26.96 | 26.96 | 26.96 | 26.96 | 26.96 | 26.96 | 26.96 | 26.96 |
| EBITAT | 1,921.9 | -2,302.7 | 1,190.4 | 1,293.8 | 2,226.3 | 1,184.9 | 1,372.6 | 1,590.0 | 1,841.8 | 2,133.5 |
| Depreciation | ||||||||||
| Changes in Account Receivables | ||||||||||
| Changes in Inventories | ||||||||||
| Changes in Accounts Payable | ||||||||||
| Capital Expenditure | ||||||||||
| UFCF | 1,239.8 | -5,027.2 | -2,157.3 | -1,146.0 | 2,313.7 | -1,875.9 | -2,002.2 | -2,319.3 | -2,686.6 | -3,112.2 |
| WACC, % | 3.67 | 3.79 | 3.7 | 3.57 | 3.64 | 3.67 | 3.67 | 3.67 | 3.67 | 3.67 |
| PV UFCF | ||||||||||
| SUM PV UFCF | -10,677.3 | |||||||||
| Long Term Growth Rate, % | 3.50 | |||||||||
| Free cash flow (T + 1) | -3,221 | |||||||||
| Terminal Value | -1,842,785 | |||||||||
| Present Terminal Value | -1,538,540 | |||||||||
| Enterprise Value | -1,549,217 | |||||||||
| Net Debt | 35,376 | |||||||||
| Equity Value | -1,584,594 | |||||||||
| Diluted Shares Outstanding, MM | 7,492 | |||||||||
| Equity Value Per Share | -211.50 |
Benefits You Will Receive
- Pre-Filled Financial Model: Utilize Beijing Jingneng Power Co., Ltd.'s actual data for accurate DCF valuation.
- Comprehensive Forecast Customization: Modify revenue growth, profit margins, WACC, and other critical factors effortlessly.
- Real-Time Calculations: Instantaneous updates allow you to view results as you adjust parameters.
- Professional-Grade Template: A polished Excel file specifically crafted for high-quality valuation.
- Flexible and Reusable: Designed for versatility, enabling repeated use for in-depth forecasting.
Core Advantages
- Customizable Forecast Inputs: Adjust essential parameters such as revenue growth, EBITDA percentage, and capital expenditures at your discretion.
- Instant DCF Valuation: Automatically computes intrinsic value, net present value (NPV), and other key metrics without delay.
- High-Precision Accuracy: Leverages Beijing Jingneng Power Co., Ltd.'s (600578SS) actual financial data for credible valuation results.
- Simplified Scenario Analysis: Effortlessly explore various assumptions and assess their impacts side by side.
- Efficiency Booster: Bypass the complexities of crafting intricate valuation models from the ground up.
How It Works
- Step 1: Download the Excel file.
- Step 2: Review Beijing Jingneng Power Co., Ltd.'s (600578SS) pre-filled financial data and forecasts.
- Step 3: Adjust key inputs such as revenue growth, WACC, and tax rates (highlighted cells).
- Step 4: Observe the DCF model update in real-time as you modify assumptions.
- Step 5: Evaluate the outputs and leverage the results for informed investment decisions.
Why Choose the Beijing Jingneng Power Co., Ltd. Calculator?
- Reliability: Powered by authentic financial data from Beijing Jingneng (600578SS) for trustworthy results.
- Versatility: Tailored to allow users to experiment and alter inputs as needed.
- Efficiency: Bypass the complexities of constructing a DCF model from the ground up.
- High-Quality: Crafted with the precision and usability expected by top financial executives.
- Intuitive: User-friendly interface designed for those without extensive financial modeling skills.
Who Should Utilize This Product?
- Investors: Assess the valuation of Beijing Jingneng Power Co., Ltd. (600578SS) before making investment decisions.
- CFOs and Financial Analysts: Optimize valuation workflows and validate financial projections.
- Startup Founders: Discover how leading energy companies like Beijing Jingneng Power Co., Ltd. (600578SS) are valued in the market.
- Consultants: Produce comprehensive valuation reports to support your clientele.
- Students and Educators: Engage with real-world data to practice and impart valuation methodologies.
Contents of the Template
- Operating and Balance Sheet Data: Pre-filled historical data and forecasts for Beijing Jingneng Power Co., Ltd. (600578SS), including revenue, EBITDA, EBIT, and capital expenditures.
- WACC Calculation: A specific sheet dedicated to the Weighted Average Cost of Capital (WACC), featuring parameters such as Beta, risk-free rate, and share price.
- DCF Valuation (Unlevered and Levered): Customizable Discounted Cash Flow models that illustrate intrinsic value with comprehensive calculations.
- Financial Statements: Pre-loaded financial statements (both annual and quarterly) to facilitate in-depth analysis.
- Key Ratios: Encompasses profitability, leverage, and efficiency ratios for Beijing Jingneng Power Co., Ltd. (600578SS).
- Dashboard and Charts: Visual representation of valuation outputs and assumptions, allowing for easy analysis of results.
Disclaimer
All information, articles, and product details provided on this website are for general informational and educational purposes only. We do not claim any ownership over, nor do we intend to infringe upon, any trademarks, copyrights, logos, brand names, or other intellectual property mentioned or depicted on this site. Such intellectual property remains the property of its respective owners, and any references here are made solely for identification or informational purposes, without implying any affiliation, endorsement, or partnership.
We make no representations or warranties, express or implied, regarding the accuracy, completeness, or suitability of any content or products presented. Nothing on this website should be construed as legal, tax, investment, financial, medical, or other professional advice. In addition, no part of this site—including articles or product references—constitutes a solicitation, recommendation, endorsement, advertisement, or offer to buy or sell any securities, franchises, or other financial instruments, particularly in jurisdictions where such activity would be unlawful.
All content is of a general nature and may not address the specific circumstances of any individual or entity. It is not a substitute for professional advice or services. Any actions you take based on the information provided here are strictly at your own risk. You accept full responsibility for any decisions or outcomes arising from your use of this website and agree to release us from any liability in connection with your use of, or reliance upon, the content or products found herein.