
|
Shanghai Jinqiao Export Processing Zone Development Co., Ltd (600639.Ss) Avaliação DCF |
Totalmente Editável: Adapte-Se Às Suas Necessidades No Excel Ou Planilhas
Design Profissional: Modelos Confiáveis E Padrão Da Indústria
Pré-Construídos Para Uso Rápido E Eficiente
Compatível com MAC/PC, totalmente desbloqueado
Não É Necessária Experiência; Fácil De Seguir
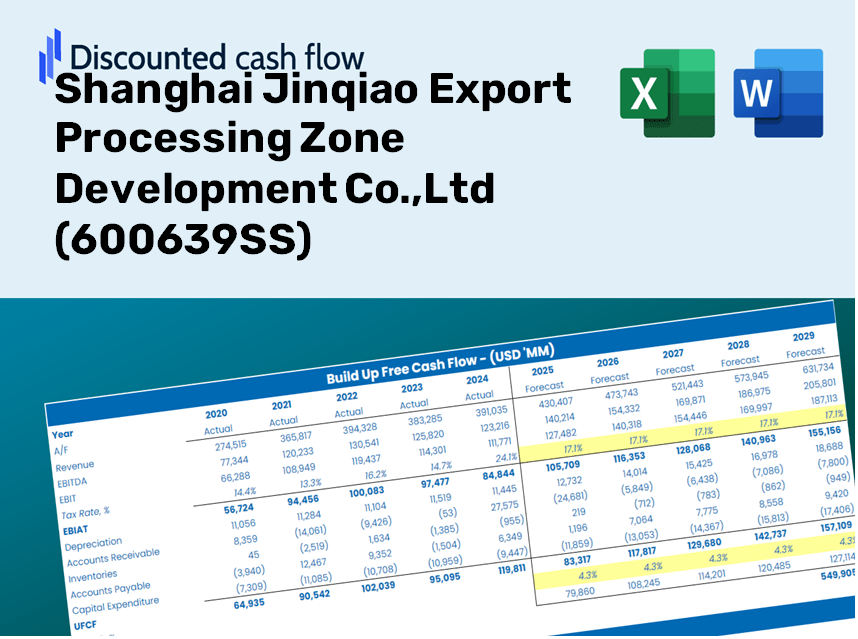
Shanghai Jinqiao Export Processing Zone Development Co.,Ltd (600639.SS) Bundle
Obtenha informações sobre sua análise de avaliação da Zona de Processamento de Exportação de Shanghai Jinqiao, LTD (600639SS), usando nossa calculadora DCF de ponta! Este modelo do Excel é pré -carregado com dados reais (600639Ss), permitindo ajustar as previsões e suposições para um cálculo preciso do valor intrínseco de Shanghai Jinqiao.
Discounted Cash Flow (DCF) - (USD MM)
| Year | AY1 2020 |
AY2 2021 |
AY3 2022 |
AY4 2023 |
AY5 2024 |
FY1 2025 |
FY2 2026 |
FY3 2027 |
FY4 2028 |
FY5 2029 |
|---|---|---|---|---|---|---|---|---|---|---|
| Revenue | 3,593.2 | 4,617.2 | 5,053.5 | 6,585.3 | 2,724.8 | 2,790.4 | 2,857.6 | 2,926.5 | 2,997.0 | 3,069.2 |
| Revenue Growth, % | 0 | 28.5 | 9.45 | 30.31 | -58.62 | 2.41 | 2.41 | 2.41 | 2.41 | 2.41 |
| EBITDA | 1,888.6 | 2,786.5 | 2,755.6 | 3,245.3 | 1,435.5 | 1,503.5 | 1,539.7 | 1,576.8 | 1,614.8 | 1,653.7 |
| EBITDA, % | 52.56 | 60.35 | 54.53 | 49.28 | 52.68 | 53.88 | 53.88 | 53.88 | 53.88 | 53.88 |
| Depreciation | 411.2 | 517.5 | 525.2 | 522.2 | 565.0 | 344.4 | 352.7 | 361.2 | 369.9 | 378.8 |
| Depreciation, % | 11.44 | 11.21 | 10.39 | 7.93 | 20.74 | 12.34 | 12.34 | 12.34 | 12.34 | 12.34 |
| EBIT | 1,477.4 | 2,269.0 | 2,230.3 | 2,723.1 | 870.5 | 1,159.1 | 1,187.0 | 1,215.6 | 1,244.9 | 1,274.9 |
| EBIT, % | 41.12 | 49.14 | 44.13 | 41.35 | 31.95 | 41.54 | 41.54 | 41.54 | 41.54 | 41.54 |
| Total Cash | 5,313.3 | 7,909.7 | 3,709.3 | 2,342.6 | 6,644.7 | 2,282.4 | 2,337.4 | 2,393.7 | 2,451.4 | 2,510.4 |
| Total Cash, percent | .0 | .0 | .0 | .0 | .0 | .0 | .0 | .0 | .0 | .0 |
| Account Receivables | 170.6 | 1,736.2 | 286.3 | .0 | 214.0 | 311.8 | 319.3 | 327.0 | 334.9 | 343.0 |
| Account Receivables, % | 4.75 | 37.6 | 5.67 | 0 | 7.85 | 11.17 | 11.17 | 11.17 | 11.17 | 11.17 |
| Inventories | 5,345.2 | 4,207.2 | 11,494.9 | 19,232.5 | 22,819.4 | 2,740.9 | 2,806.9 | 2,874.5 | 2,943.7 | 3,014.7 |
| Inventories, % | 148.76 | 91.12 | 227.47 | 292.05 | 837.48 | 98.22 | 98.22 | 98.22 | 98.22 | 98.22 |
| Accounts Payable | 1,348.6 | 1,676.3 | 1,396.6 | 1,572.8 | 865.1 | 876.8 | 897.9 | 919.5 | 941.7 | 964.4 |
| Accounts Payable, % | 37.53 | 36.31 | 27.64 | 23.88 | 31.75 | 31.42 | 31.42 | 31.42 | 31.42 | 31.42 |
| Capital Expenditure | -13.4 | -12.4 | -7.7 | -27.1 | -56.5 | -18.3 | -18.8 | -19.2 | -19.7 | -20.1 |
| Capital Expenditure, % | -0.37364 | -0.26882 | -0.15335 | -0.41154 | -2.07 | -0.65644 | -0.65644 | -0.65644 | -0.65644 | -0.65644 |
| Tax Rate, % | 25.44 | 25.44 | 25.44 | 25.44 | 25.44 | 25.44 | 25.44 | 25.44 | 25.44 | 25.44 |
| EBITAT | 1,109.8 | 1,725.8 | 1,691.9 | 2,056.9 | 649.1 | 874.3 | 895.3 | 916.9 | 939.0 | 961.6 |
| Depreciation | ||||||||||
| Changes in Account Receivables | ||||||||||
| Changes in Inventories | ||||||||||
| Changes in Accounts Payable | ||||||||||
| Capital Expenditure | ||||||||||
| UFCF | -2,659.7 | 2,131.2 | -3,908.3 | -4,723.0 | -3,351.1 | 21,192.8 | 1,176.9 | 1,205.2 | 1,234.2 | 1,264.0 |
| WACC, % | 3.95 | 3.97 | 3.96 | 3.96 | 3.94 | 3.96 | 3.96 | 3.96 | 3.96 | 3.96 |
| PV UFCF | ||||||||||
| SUM PV UFCF | 24,646.3 | |||||||||
| Long Term Growth Rate, % | 0.50 | |||||||||
| Free cash flow (T + 1) | 1,270 | |||||||||
| Terminal Value | 36,765 | |||||||||
| Present Terminal Value | 30,283 | |||||||||
| Enterprise Value | 54,930 | |||||||||
| Net Debt | 12,658 | |||||||||
| Equity Value | 42,272 | |||||||||
| Diluted Shares Outstanding, MM | 1,122 | |||||||||
| Equity Value Per Share | 37.68 |
Benefits You Will Receive
- Authentic Shanghai Jinqiao Data: Comprehensive financials – including revenue and EBIT – derived from actual and projected metrics.
- Complete Customization: Modify all essential parameters (yellow cells) such as WACC, growth %, and tax rates according to your needs.
- Real-Time Valuation Updates: Automatic recalculations to evaluate how changes affect the fair value of Shanghai Jinqiao Export Processing Zone Development Co.,Ltd (600639SS).
- Flexible Excel Template: Designed for quick modifications, scenario analysis, and thorough forecasting.
- Efficient and Precise: Avoid the hassle of building models from the ground up while ensuring accuracy and adaptability.
Key Features
- Accurate Financial Data for Shanghai Jinqiao: Gain access to reliable pre-loaded historical data and future projections specific to (600639SS).
- Tailored Forecasting Parameters: Modify the yellow-highlighted fields such as WACC, growth rates, and margins to fit your analysis.
- Automated Calculations: Experience real-time updates for DCF, Net Present Value (NPV), and cash flow assessments.
- Interactive Visual Dashboard: Enjoy user-friendly charts and summaries to effectively display your valuation outcomes.
- Designed for All Users: An intuitive layout suitable for investors, CFOs, and consultants, catering to both novices and experts.
How It Works
- Step 1: Download the Excel file.
- Step 2: Examine the pre-filled financial data and forecasts for Shanghai Jinqiao Export Processing Zone Development Co.,Ltd (600639SS).
- Step 3: Adjust key inputs such as revenue growth, WACC, and tax rates (highlighted cells).
- Step 4: Observe the DCF model refresh instantly as you modify your assumptions.
- Step 5: Evaluate the results and leverage the insights for your investment choices.
Why Choose Our Services?
- Reliability: Backed by robust data from Shanghai Jinqiao Export Processing Zone Development Co., Ltd (600639SS).
- Adaptability: Tailored for clients to easily adjust and experiment with various parameters.
- Efficiency: Eliminate the need to create processes from the ground up.
- High-Quality Standards: Crafted to meet the highest industry benchmarks in precision and functionality.
- Intuitive Design: Simple to navigate, even for those new to export processing or financial analysis.
Who Can Benefit from This Product?
- Finance Students: Acquire valuation skills and practice them using authentic market data.
- Researchers: Integrate advanced financial models into your studies or academic papers.
- Investors: Evaluate your hypotheses and assess valuation outcomes for Shanghai Jinqiao Export Processing Zone Development Co., Ltd (600639SS).
- Financial Analysts: Enhance your efficiency with a ready-to-use, customizable DCF model.
- Small Business Entrepreneurs: Understand the evaluation processes of large publicly traded companies like Shanghai Jinqiao Export Processing Zone Development Co., Ltd (600639SS).
Contents of the Template
- Historical Data: Comprises Shanghai Jinqiao Export Processing Zone Development Co., Ltd's (600639SS) previous financial performance and foundational forecasts.
- DCF and Levered DCF Models: Comprehensive templates designed to calculate the intrinsic value of Shanghai Jinqiao Export Processing Zone Development Co., Ltd (600639SS).
- WACC Sheet: Pre-configured calculations for the Weighted Average Cost of Capital.
- Editable Inputs: Adjust essential variables such as growth rates, EBITDA percentages, and CAPEX assumptions.
- Quarterly and Annual Statements: A thorough examination of the financials of Shanghai Jinqiao Export Processing Zone Development Co., Ltd (600639SS).
- Interactive Dashboard: Dynamically visualize valuation outcomes and future projections.
Disclaimer
All information, articles, and product details provided on this website are for general informational and educational purposes only. We do not claim any ownership over, nor do we intend to infringe upon, any trademarks, copyrights, logos, brand names, or other intellectual property mentioned or depicted on this site. Such intellectual property remains the property of its respective owners, and any references here are made solely for identification or informational purposes, without implying any affiliation, endorsement, or partnership.
We make no representations or warranties, express or implied, regarding the accuracy, completeness, or suitability of any content or products presented. Nothing on this website should be construed as legal, tax, investment, financial, medical, or other professional advice. In addition, no part of this site—including articles or product references—constitutes a solicitation, recommendation, endorsement, advertisement, or offer to buy or sell any securities, franchises, or other financial instruments, particularly in jurisdictions where such activity would be unlawful.
All content is of a general nature and may not address the specific circumstances of any individual or entity. It is not a substitute for professional advice or services. Any actions you take based on the information provided here are strictly at your own risk. You accept full responsibility for any decisions or outcomes arising from your use of this website and agree to release us from any liability in connection with your use of, or reliance upon, the content or products found herein.