
|
Shanghai Waigaoqiao Livre Trade Zone Group Co., Ltd. (600648.ss) DCF Avaliação |
Totalmente Editável: Adapte-Se Às Suas Necessidades No Excel Ou Planilhas
Design Profissional: Modelos Confiáveis E Padrão Da Indústria
Pré-Construídos Para Uso Rápido E Eficiente
Compatível com MAC/PC, totalmente desbloqueado
Não É Necessária Experiência; Fácil De Seguir
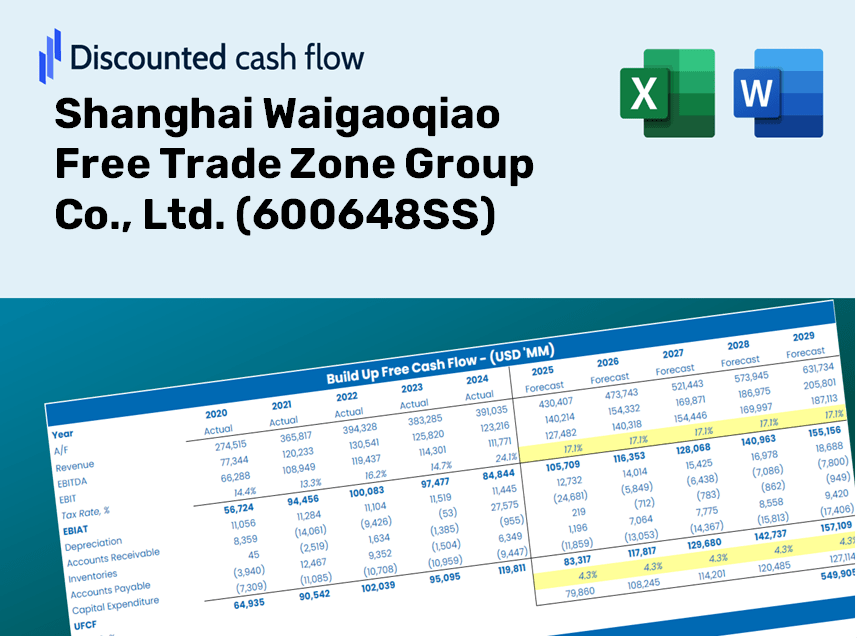
Shanghai Waigaoqiao Free Trade Zone Group Co., Ltd. (600648.SS) Bundle
Avalie as perspectivas financeiras da Shanghai Waigaoqiao Livre Trade Zone Group Co., Ltd. (600648Ss) como um especialista! Esta calculadora (600648SS) DCF fornece dados financeiros pré-preenchidos e flexibilidade para modificar o crescimento da receita, o WACC, as margens e outras suposições essenciais para corresponder às suas projeções.
Discounted Cash Flow (DCF) - (USD MM)
| Year | AY1 2020 |
AY2 2021 |
AY3 2022 |
AY4 2023 |
AY5 2024 |
FY1 2025 |
FY2 2026 |
FY3 2027 |
FY4 2028 |
FY5 2029 |
|---|---|---|---|---|---|---|---|---|---|---|
| Revenue | 10,218.7 | 8,884.2 | 9,201.2 | 7,694.9 | 7,239.7 | 6,664.6 | 6,135.1 | 5,647.7 | 5,199.0 | 4,786.0 |
| Revenue Growth, % | 0 | -13.06 | 3.57 | -16.37 | -5.92 | -7.94 | -7.94 | -7.94 | -7.94 | -7.94 |
| EBITDA | 2,069.6 | 2,478.4 | 2,555.2 | 2,213.2 | 1,992.7 | 1,762.2 | 1,622.2 | 1,493.3 | 1,374.7 | 1,265.5 |
| EBITDA, % | 20.25 | 27.9 | 27.77 | 28.76 | 27.52 | 26.44 | 26.44 | 26.44 | 26.44 | 26.44 |
| Depreciation | 702.3 | 803.3 | 809.6 | 802.5 | 816.7 | 618.8 | 569.6 | 524.4 | 482.7 | 444.4 |
| Depreciation, % | 6.87 | 9.04 | 8.8 | 10.43 | 11.28 | 9.28 | 9.28 | 9.28 | 9.28 | 9.28 |
| EBIT | 1,367.3 | 1,675.1 | 1,745.6 | 1,410.7 | 1,176.1 | 1,143.4 | 1,052.6 | 969.0 | 892.0 | 821.1 |
| EBIT, % | 13.38 | 18.85 | 18.97 | 18.33 | 16.24 | 17.16 | 17.16 | 17.16 | 17.16 | 17.16 |
| Total Cash | 6,597.9 | 9,536.0 | 7,058.4 | 7,430.4 | 6,044.5 | 5,616.0 | 5,169.8 | 4,759.1 | 4,381.1 | 4,033.0 |
| Total Cash, percent | .0 | .0 | .0 | .0 | .0 | .0 | .0 | .0 | .0 | .0 |
| Account Receivables | 452.2 | 1,531.7 | 877.6 | 1,298.4 | 1,265.7 | 873.9 | 804.4 | 740.5 | 681.7 | 627.5 |
| Account Receivables, % | 4.43 | 17.24 | 9.54 | 16.87 | 17.48 | 13.11 | 13.11 | 13.11 | 13.11 | 13.11 |
| Inventories | 12,474.2 | 10,794.7 | 12,288.8 | 13,213.8 | 11,023.4 | 6,664.6 | 6,135.1 | 5,647.7 | 5,199.0 | 4,786.0 |
| Inventories, % | 122.07 | 121.5 | 133.56 | 171.72 | 152.26 | 100 | 100 | 100 | 100 | 100 |
| Accounts Payable | 2,575.0 | 3,121.5 | 2,874.6 | 2,747.0 | 3,204.6 | 2,286.5 | 2,104.8 | 1,937.6 | 1,783.7 | 1,642.0 |
| Accounts Payable, % | 25.2 | 35.13 | 31.24 | 35.7 | 44.26 | 34.31 | 34.31 | 34.31 | 34.31 | 34.31 |
| Capital Expenditure | -198.1 | -98.3 | -417.8 | -919.7 | -677.7 | -385.2 | -354.6 | -326.4 | -300.5 | -276.6 |
| Capital Expenditure, % | -1.94 | -1.11 | -4.54 | -11.95 | -9.36 | -5.78 | -5.78 | -5.78 | -5.78 | -5.78 |
| Tax Rate, % | 26.74 | 26.74 | 26.74 | 26.74 | 26.74 | 26.74 | 26.74 | 26.74 | 26.74 | 26.74 |
| EBITAT | 934.5 | 1,174.2 | 1,301.8 | 1,045.8 | 861.6 | 824.2 | 758.7 | 698.5 | 643.0 | 591.9 |
| Depreciation | ||||||||||
| Changes in Account Receivables | ||||||||||
| Changes in Inventories | ||||||||||
| Changes in Accounts Payable | ||||||||||
| Capital Expenditure | ||||||||||
| UFCF | -8,912.7 | 3,025.8 | 606.7 | -544.7 | 3,681.1 | 4,890.3 | 1,391.0 | 1,280.5 | 1,178.8 | 1,085.1 |
| WACC, % | 4.18 | 4.22 | 4.32 | 4.31 | 4.29 | 4.26 | 4.26 | 4.26 | 4.26 | 4.26 |
| PV UFCF | ||||||||||
| SUM PV UFCF | 8,977.7 | |||||||||
| Long Term Growth Rate, % | 2.00 | |||||||||
| Free cash flow (T + 1) | 1,107 | |||||||||
| Terminal Value | 48,885 | |||||||||
| Present Terminal Value | 39,673 | |||||||||
| Enterprise Value | 48,651 | |||||||||
| Net Debt | 12,222 | |||||||||
| Equity Value | 36,429 | |||||||||
| Diluted Shares Outstanding, MM | 1,133 | |||||||||
| Equity Value Per Share | 32.16 |
Benefits You Will Receive
- Comprehensive Financial Model: Utilize Shanghai Waigaoqiao Free Trade Zone Group Co., Ltd.'s actual data for accurate DCF valuation.
- Complete Forecast Management: Modify revenue growth, profit margins, WACC, and other crucial factors.
- Real-Time Calculations: Automatic updates to display results immediately as you make adjustments.
- Professional-Grade Template: A polished Excel file crafted for high-quality valuation purposes.
- Flexible and Reusable: Designed for adaptability, enabling repeated application for in-depth forecasts.
Key Features
- Comprehensive Data Repository: Access to Shanghai Waigaoqiao Free Trade Zone Group Co., Ltd.’s historical financial records and pre-populated forecasts.
- Customizable Parameters: Adjust WACC, tax rates, revenue growth, and EBITDA margins to suit your analysis.
- Real-Time Insights: Instantly view recalibrated intrinsic values for Shanghai Waigaoqiao Free Trade Zone Group Co., Ltd. in real time.
- Intuitive Visual Reports: Engaging dashboard charts illustrate valuation outcomes and essential metrics.
- Designed for Precision: A robust tool tailored for analysts, investors, and finance professionals.
How It Operates
- Download: Obtain the pre-built Excel file containing Shanghai Waigaoqiao Free Trade Zone Group Co., Ltd.'s financial data.
- Customize: Modify forecasts, such as revenue growth, EBITDA percentage, and WACC.
- Update Automatically: Intrinsic value and NPV calculations refresh in real-time.
- Test Scenarios: Generate multiple projections and compare results immediately.
- Make Decisions: Leverage valuation outcomes to inform your investment strategies for (600648SS).
Why Opt for This Calculator?
- User-Friendly Design: Tailored for both novices and seasoned professionals.
- Customizable Inputs: Effortlessly adjust parameters to suit your analysis needs.
- Real-Time Feedback: Instantly observe changes in Shanghai Waigaoqiao Free Trade Zone Group Co., Ltd. (600648SS) valuation as you tweak inputs.
- Preloaded Data: Comes equipped with actual financial metrics for swift evaluations.
- Relied Upon by Experts: A go-to tool for analysts and investors making informed choices.
Who Can Benefit from This Product?
- Individual Investors: Make educated decisions regarding the purchase or sale of Shanghai Waigaoqiao Free Trade Zone Group Co., Ltd. (600648SS) shares.
- Financial Analysts: Enhance valuation workflows with comprehensive financial models tailored for this company.
- Consultants: Provide clients with accurate and timely valuation insights related to Shanghai Waigaoqiao Free Trade Zone Group Co., Ltd. (600648SS).
- Business Owners: Gain insights into how large entities like Shanghai Waigaoqiao Free Trade Zone Group Co., Ltd. (600648SS) are valued to inform your own business strategies.
- Finance Students: Explore valuation methodologies using real-world data and case studies from Shanghai Waigaoqiao Free Trade Zone Group Co., Ltd. (600648SS).
Contents of the Template
- Operating and Balance Sheet Data: Pre-filled historical data and forecasts for Shanghai Waigaoqiao Free Trade Zone Group Co., Ltd. (600648SS), including metrics such as revenue, EBITDA, EBIT, and capital expenditures.
- WACC Calculation: A dedicated sheet for calculating the Weighted Average Cost of Capital (WACC), featuring key parameters such as Beta, risk-free rate, and share price.
- DCF Valuation (Unlevered and Levered): Editable Discounted Cash Flow models that demonstrate intrinsic value along with comprehensive calculations.
- Financial Statements: Pre-loaded financial statements (annual and quarterly) to enhance the analysis process.
- Key Ratios: Contains profitability, leverage, and efficiency ratios specific to Shanghai Waigaoqiao Free Trade Zone Group Co., Ltd. (600648SS).
- Dashboard and Charts: A visual summary of valuation outputs and assumptions for straightforward result analysis.
Disclaimer
All information, articles, and product details provided on this website are for general informational and educational purposes only. We do not claim any ownership over, nor do we intend to infringe upon, any trademarks, copyrights, logos, brand names, or other intellectual property mentioned or depicted on this site. Such intellectual property remains the property of its respective owners, and any references here are made solely for identification or informational purposes, without implying any affiliation, endorsement, or partnership.
We make no representations or warranties, express or implied, regarding the accuracy, completeness, or suitability of any content or products presented. Nothing on this website should be construed as legal, tax, investment, financial, medical, or other professional advice. In addition, no part of this site—including articles or product references—constitutes a solicitation, recommendation, endorsement, advertisement, or offer to buy or sell any securities, franchises, or other financial instruments, particularly in jurisdictions where such activity would be unlawful.
All content is of a general nature and may not address the specific circumstances of any individual or entity. It is not a substitute for professional advice or services. Any actions you take based on the information provided here are strictly at your own risk. You accept full responsibility for any decisions or outcomes arising from your use of this website and agree to release us from any liability in connection with your use of, or reliance upon, the content or products found herein.