
|
China Security Co., Ltd. (600654.SS) Avaliação DCF |
Totalmente Editável: Adapte-Se Às Suas Necessidades No Excel Ou Planilhas
Design Profissional: Modelos Confiáveis E Padrão Da Indústria
Pré-Construídos Para Uso Rápido E Eficiente
Compatível com MAC/PC, totalmente desbloqueado
Não É Necessária Experiência; Fácil De Seguir
China Security Co., Ltd. (600654.SS) Bundle
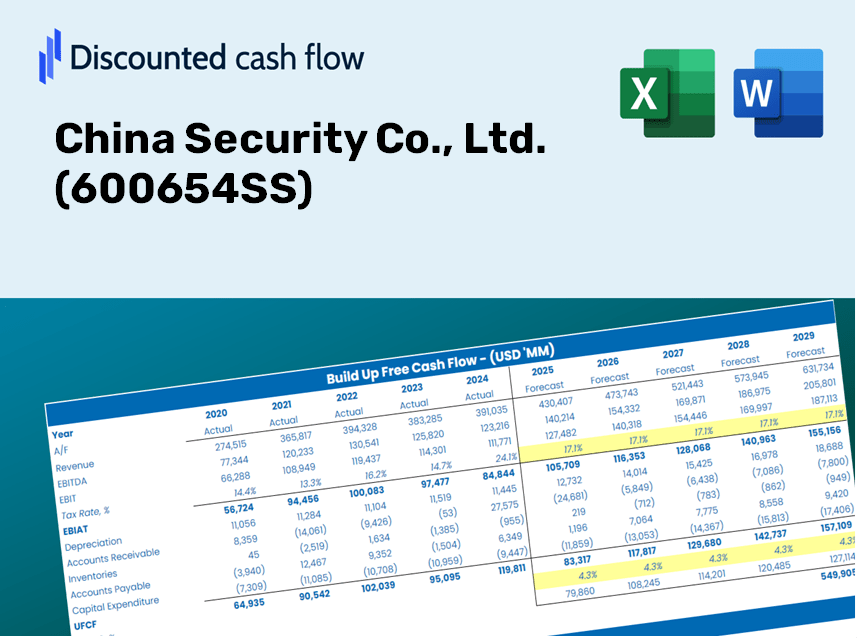
Examine a China Security Co., Ltd. As perspectivas financeiras com experiência! Esta calculadora (600654SS) DCF fornece dados financeiros pré-preenchidos e oferece total flexibilidade para modificar o crescimento da receita, o WACC, as margens e outras suposições cruciais para se alinhar às suas previsões.
Discounted Cash Flow (DCF) - (USD MM)
| Year | AY1 2020 |
AY2 2021 |
AY3 2022 |
AY4 2023 |
AY5 2024 |
FY1 2025 |
FY2 2026 |
FY3 2027 |
FY4 2028 |
FY5 2029 |
|---|---|---|---|---|---|---|---|---|---|---|
| Revenue | 3,014.3 | 2,520.0 | 2,542.2 | 2,858.1 | 3,050.6 | 3,078.4 | 3,106.4 | 3,134.7 | 3,163.3 | 3,192.1 |
| Revenue Growth, % | 0 | -16.4 | 0.88306 | 12.43 | 6.73 | 0.91083 | 0.91083 | 0.91083 | 0.91083 | 0.91083 |
| EBITDA | -268.6 | -197.1 | -293.5 | 118.9 | -3.4 | -149.1 | -150.5 | -151.9 | -153.3 | -154.7 |
| EBITDA, % | -8.91 | -7.82 | -11.54 | 4.16 | -0.11112 | -4.84 | -4.84 | -4.84 | -4.84 | -4.84 |
| Depreciation | 61.6 | 65.1 | 57.0 | 56.9 | 49.0 | 64.4 | 65.0 | 65.6 | 66.2 | 66.8 |
| Depreciation, % | 2.04 | 2.58 | 2.24 | 1.99 | 1.61 | 2.09 | 2.09 | 2.09 | 2.09 | 2.09 |
| EBIT | -330.1 | -262.1 | -350.5 | 62.0 | -52.4 | -213.6 | -215.5 | -217.5 | -219.5 | -221.5 |
| EBIT, % | -10.95 | -10.4 | -13.79 | 2.17 | -1.72 | -6.94 | -6.94 | -6.94 | -6.94 | -6.94 |
| Total Cash | 505.3 | 507.4 | 1,136.7 | 737.4 | 759.4 | 814.6 | 822.0 | 829.5 | 837.0 | 844.6 |
| Total Cash, percent | .0 | .0 | .0 | .0 | .0 | .0 | .0 | .0 | .0 | .0 |
| Account Receivables | 1,736.1 | 1,790.1 | 1,565.7 | 1,437.5 | 1,531.9 | 1,790.0 | 1,806.3 | 1,822.7 | 1,839.3 | 1,856.1 |
| Account Receivables, % | 57.59 | 71.04 | 61.59 | 50.3 | 50.21 | 58.15 | 58.15 | 58.15 | 58.15 | 58.15 |
| Inventories | 89.4 | 98.6 | 141.7 | 133.7 | 84.5 | 122.5 | 123.6 | 124.7 | 125.9 | 127.0 |
| Inventories, % | 2.96 | 3.91 | 5.57 | 4.68 | 2.77 | 3.98 | 3.98 | 3.98 | 3.98 | 3.98 |
| Accounts Payable | 652.6 | 670.2 | 833.2 | 795.6 | 864.4 | 844.7 | 852.3 | 860.1 | 867.9 | 875.9 |
| Accounts Payable, % | 21.65 | 26.6 | 32.78 | 27.84 | 28.33 | 27.44 | 27.44 | 27.44 | 27.44 | 27.44 |
| Capital Expenditure | -60.0 | -31.7 | -19.3 | -38.2 | -54.4 | -43.9 | -44.3 | -44.7 | -45.1 | -45.5 |
| Capital Expenditure, % | -1.99 | -1.26 | -0.75949 | -1.34 | -1.78 | -1.43 | -1.43 | -1.43 | -1.43 | -1.43 |
| Tax Rate, % | 42.86 | 42.86 | 42.86 | 42.86 | 42.86 | 42.86 | 42.86 | 42.86 | 42.86 | 42.86 |
| EBITAT | -264.9 | -260.8 | -326.3 | 57.9 | -29.9 | -180.9 | -182.5 | -184.2 | -185.8 | -187.5 |
| Depreciation | ||||||||||
| Changes in Account Receivables | ||||||||||
| Changes in Inventories | ||||||||||
| Changes in Accounts Payable | ||||||||||
| Capital Expenditure | ||||||||||
| UFCF | -1,436.1 | -273.0 | 55.6 | 175.3 | -11.6 | -476.1 | -171.5 | -173.1 | -174.6 | -176.2 |
| WACC, % | 9.15 | 9.19 | 9.18 | 9.18 | 9.09 | 9.16 | 9.16 | 9.16 | 9.16 | 9.16 |
| PV UFCF | ||||||||||
| SUM PV UFCF | -949.9 | |||||||||
| Long Term Growth Rate, % | 4.00 | |||||||||
| Free cash flow (T + 1) | -183 | |||||||||
| Terminal Value | -3,554 | |||||||||
| Present Terminal Value | -2,293 | |||||||||
| Enterprise Value | -3,243 | |||||||||
| Net Debt | -542 | |||||||||
| Equity Value | -2,701 | |||||||||
| Diluted Shares Outstanding, MM | 2,861 | |||||||||
| Equity Value Per Share | -0.94 |
What You Will Receive
- Authentic 600654SS Financials: Comprehensive historical and projected data for precise valuation.
- Customizable Parameters: Adjust key factors such as WACC, tax rates, revenue growth, and capital expenditures.
- Real-Time Calculations: Intrinsic value and NPV are computed automatically.
- Scenario Simulation: Explore various scenarios to assess China Security Co., Ltd.'s future prospects.
- User-Friendly Interface: Designed for industry professionals while remaining accessible to newcomers.
Key Features
- Authentic Financial Data: Gain access to precise historical data and future forecast metrics for China Security Co., Ltd. (600654SS).
- Tailorable Forecast Inputs: Modify highlighted cells such as WACC, growth rates, and profit margins to fit your analysis.
- Automated Calculations: Enjoy real-time updates for DCF, Net Present Value (NPV), and cash flow assessments.
- Interactive Dashboard: Utilize user-friendly charts and summaries to clearly present your valuation findings.
- Suitable for All Levels: An intuitive design crafted for investors, CFOs, and consultants, from novices to experts.
How It Works
- Step 1: Download the Excel file.
- Step 2: Examine the pre-filled China Security Co., Ltd. (600654SS) data (historical and projected).
- Step 3: Modify the key assumptions (yellow cells) according to your analysis.
- Step 4: Observe the automatic recalculations for China Security Co., Ltd.’s intrinsic value.
- Step 5: Utilize the results for investment decisions or reporting.
Why Opt for This Calculator?
- All-in-One Solution: Features DCF, WACC, and financial ratio analyses seamlessly integrated.
- Flexible Inputs: Modify the yellow-highlighted fields to explore various scenarios.
- In-Depth Analysis: Automatically computes the intrinsic value and Net Present Value for China Security Co., Ltd. (600654SS).
- Preloaded Information: Comes with historical and projected data for reliable analysis.
- High Standards: Perfect for financial analysts, investors, and business consultants alike.
Who Should Utilize This Product?
- Investors: Precisely assess the fair value of China Security Co., Ltd. (600654SS) prior to making investment choices.
- CFOs: Utilize a high-quality DCF model for comprehensive financial reporting and analysis.
- Consultants: Efficiently customize the template for client valuation reports.
- Entrepreneurs: Acquire valuable insights into financial modeling applied by leading corporations.
- Educators: Employ this as a teaching resource to illustrate various valuation methods.
Contents of the Template
- Pre-Filled DCF Model: Financial data for China Security Co., Ltd. (600654SS) preloaded for immediate analysis.
- WACC Calculator: Comprehensive calculations for the Weighted Average Cost of Capital.
- Financial Ratios: Assess China Security Co., Ltd. (600654SS)'s profitability, leverage, and operational efficiency.
- Editable Inputs: Modify assumptions regarding growth, margins, and capital expenditures to suit your specific scenarios.
- Financial Statements: Access detailed annual and quarterly reports for in-depth evaluation.
- Interactive Dashboard: Effortlessly visualize key valuation metrics and outcomes.
Disclaimer
All information, articles, and product details provided on this website are for general informational and educational purposes only. We do not claim any ownership over, nor do we intend to infringe upon, any trademarks, copyrights, logos, brand names, or other intellectual property mentioned or depicted on this site. Such intellectual property remains the property of its respective owners, and any references here are made solely for identification or informational purposes, without implying any affiliation, endorsement, or partnership.
We make no representations or warranties, express or implied, regarding the accuracy, completeness, or suitability of any content or products presented. Nothing on this website should be construed as legal, tax, investment, financial, medical, or other professional advice. In addition, no part of this site—including articles or product references—constitutes a solicitation, recommendation, endorsement, advertisement, or offer to buy or sell any securities, franchises, or other financial instruments, particularly in jurisdictions where such activity would be unlawful.
All content is of a general nature and may not address the specific circumstances of any individual or entity. It is not a substitute for professional advice or services. Any actions you take based on the information provided here are strictly at your own risk. You accept full responsibility for any decisions or outcomes arising from your use of this website and agree to release us from any liability in connection with your use of, or reliance upon, the content or products found herein.