
|
Guangdong HEC Technologyholding Co., Ltd (600673.Ss) Avaliação DCF |
Totalmente Editável: Adapte-Se Às Suas Necessidades No Excel Ou Planilhas
Design Profissional: Modelos Confiáveis E Padrão Da Indústria
Pré-Construídos Para Uso Rápido E Eficiente
Compatível com MAC/PC, totalmente desbloqueado
Não É Necessária Experiência; Fácil De Seguir
Guangdong Hec Technologyholding Co., Ltd (600673.SS) Bundle
Avalie as perspectivas financeiras da Guangdong Hec Technologyholding Co., Ltd, como um especialista! Esta calculadora (600673SS) DCF fornece dados financeiros pré-preenchidos e flexibilidade completa para modificar o crescimento da receita, WACC, margens e outras suposições essenciais para se alinhar às suas previsões.
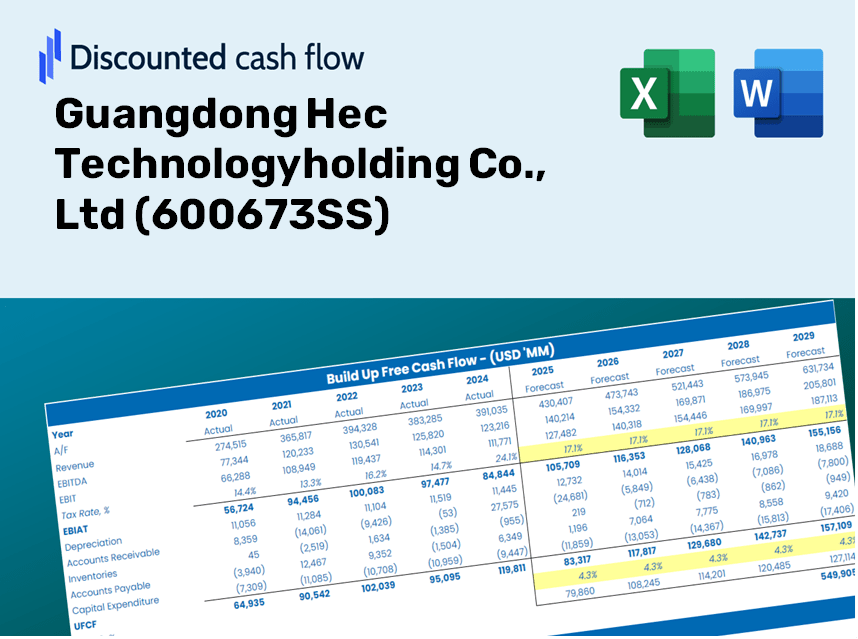
Discounted Cash Flow (DCF) - (USD MM)
| Year | AY1 2020 |
AY2 2021 |
AY3 2022 |
AY4 2023 |
AY5 2024 |
FY1 2025 |
FY2 2026 |
FY3 2027 |
FY4 2028 |
FY5 2029 |
|---|---|---|---|---|---|---|---|---|---|---|
| Revenue | 10,370.6 | 12,802.2 | 11,699.0 | 10,853.7 | 12,199.1 | 12,809.1 | 13,449.5 | 14,122.0 | 14,828.1 | 15,569.5 |
| Revenue Growth, % | 0 | 23.45 | -8.62 | -7.23 | 12.4 | 5 | 5 | 5 | 5 | 5 |
| EBITDA | 1,458.3 | 1,506.7 | 1,879.5 | 504.4 | 1,199.7 | 1,444.3 | 1,516.5 | 1,592.3 | 1,671.9 | 1,755.5 |
| EBITDA, % | 14.06 | 11.77 | 16.07 | 4.65 | 9.83 | 11.28 | 11.28 | 11.28 | 11.28 | 11.28 |
| Depreciation | 712.4 | 838.2 | 578.5 | 573.0 | 607.3 | 733.2 | 769.9 | 808.3 | 848.8 | 891.2 |
| Depreciation, % | 6.87 | 6.55 | 4.95 | 5.28 | 4.98 | 5.72 | 5.72 | 5.72 | 5.72 | 5.72 |
| EBIT | 745.9 | 668.5 | 1,300.9 | -68.7 | 592.4 | 711.1 | 746.6 | 784.0 | 823.2 | 864.3 |
| EBIT, % | 7.19 | 5.22 | 11.12 | -0.63274 | 4.86 | 5.55 | 5.55 | 5.55 | 5.55 | 5.55 |
| Total Cash | 6,176.4 | 5,815.9 | 5,507.1 | 5,001.1 | 4,281.5 | 5,975.0 | 6,273.8 | 6,587.4 | 6,916.8 | 7,262.7 |
| Total Cash, percent | .0 | .0 | .0 | .0 | .0 | .0 | .0 | .0 | .0 | .0 |
| Account Receivables | 4,606.1 | 5,046.0 | 3,368.5 | 2,936.3 | 2,901.3 | 4,187.5 | 4,396.9 | 4,616.7 | 4,847.6 | 5,090.0 |
| Account Receivables, % | 44.41 | 39.42 | 28.79 | 27.05 | 23.78 | 32.69 | 32.69 | 32.69 | 32.69 | 32.69 |
| Inventories | 1,620.4 | 1,326.4 | 1,932.8 | 1,494.7 | 1,771.5 | 1,813.8 | 1,904.5 | 1,999.7 | 2,099.7 | 2,204.7 |
| Inventories, % | 15.62 | 10.36 | 16.52 | 13.77 | 14.52 | 14.16 | 14.16 | 14.16 | 14.16 | 14.16 |
| Accounts Payable | 2,185.0 | 2,028.0 | 3,041.1 | 1,373.0 | 2,653.3 | 2,492.8 | 2,617.4 | 2,748.3 | 2,885.7 | 3,030.0 |
| Accounts Payable, % | 21.07 | 15.84 | 25.99 | 12.65 | 21.75 | 19.46 | 19.46 | 19.46 | 19.46 | 19.46 |
| Capital Expenditure | -2,413.3 | -1,112.5 | -1,441.2 | -1,597.9 | -1,144.4 | -1,751.8 | -1,839.4 | -1,931.4 | -2,027.9 | -2,129.3 |
| Capital Expenditure, % | -23.27 | -8.69 | -12.32 | -14.72 | -9.38 | -13.68 | -13.68 | -13.68 | -13.68 | -13.68 |
| Tax Rate, % | -1.94 | -1.94 | -1.94 | -1.94 | -1.94 | -1.94 | -1.94 | -1.94 | -1.94 | -1.94 |
| EBITAT | 305.6 | 634.2 | 1,080.9 | -59.4 | 604.0 | 576.5 | 605.3 | 635.6 | 667.4 | 700.7 |
| Depreciation | ||||||||||
| Changes in Account Receivables | ||||||||||
| Changes in Inventories | ||||||||||
| Changes in Accounts Payable | ||||||||||
| Capital Expenditure | ||||||||||
| UFCF | -5,436.7 | 57.0 | 2,302.6 | -1,882.1 | 1,105.3 | -1,931.1 | -639.7 | -671.6 | -705.2 | -740.5 |
| WACC, % | 4.44 | 4.75 | 4.68 | 4.7 | 4.78 | 4.67 | 4.67 | 4.67 | 4.67 | 4.67 |
| PV UFCF | ||||||||||
| SUM PV UFCF | -4,191.2 | |||||||||
| Long Term Growth Rate, % | 3.50 | |||||||||
| Free cash flow (T + 1) | -766 | |||||||||
| Terminal Value | -65,392 | |||||||||
| Present Terminal Value | -52,044 | |||||||||
| Enterprise Value | -56,236 | |||||||||
| Net Debt | 5,623 | |||||||||
| Equity Value | -61,858 | |||||||||
| Diluted Shares Outstanding, MM | 2,885 | |||||||||
| Equity Value Per Share | -21.44 |
Benefits You Will Receive
- Editable Assumptions: Effortlessly modify inputs (growth %, margins, WACC) to generate various scenarios.
- Comprehensive Data: Pre-filled financial information for Guangdong Hec Technologyholding Co., Ltd (600673SS) to kickstart your analysis.
- Automated DCF Calculations: The template provides Net Present Value (NPV) and intrinsic value calculations automatically.
- Professional and Flexible: A sleek Excel model that can be tailored to meet your valuation requirements.
- Designed for Analysts and Investors: Perfect for testing forecasts, validating strategies, and enhancing efficiency.
Key Features
- Comprehensive DCF Calculator: Offers detailed unlevered and levered DCF valuation models tailored for Guangdong Hec Technologyholding Co., Ltd (600673SS).
- WACC Calculator: Includes a pre-built Weighted Average Cost of Capital sheet with adjustable inputs for precise financial analysis.
- Customizable Forecast Assumptions: Adjust growth rates, capital expenditures, and discount rates to fit your analysis needs.
- Integrated Financial Ratios: Evaluate profitability, leverage, and efficiency ratios specifically for Guangdong Hec Technologyholding Co., Ltd (600673SS).
- Visual Dashboard and Charts: Provides visual outputs that summarize key valuation metrics, making analysis straightforward and efficient.
How It Operates
- 1. Access the Template: Download and open the Excel file containing Guangdong Hec Technologyholding Co., Ltd's preloaded data.
- 2. Modify Assumptions: Adjust critical inputs such as growth rates, WACC, and capital expenditures as needed.
- 3. Instant Results: The DCF model automatically calculates intrinsic value and NPV in real-time.
- 4. Evaluate Scenarios: Analyze various forecasts to assess different valuation results.
- 5. Make Informed Decisions: Use professional valuation insights to enhance your decision-making process.
Why Choose This Calculator for Guangdong Hec Technologyholding Co., Ltd (600673SS)?
- Designed for Experts: An advanced tool tailored for analysts, CFOs, and industry consultants.
- Accurate Financial Data: Historical and forecasted financials for Guangdong Hec pre-loaded for precision.
- Comprehensive Scenario Analysis: Easily test various forecasts and assumptions.
- Concise Output: Automatically determines intrinsic value, NPV, and essential metrics.
- User-Friendly: Step-by-step guidance makes the process straightforward.
Who Should Consider This Product?
- Professional Investors: Create comprehensive and trustworthy valuation models for investment portfolio assessments in Guangdong Hec Technology (600673SS).
- Corporate Finance Teams: Evaluate valuation scenarios to inform strategic decisions within the company.
- Consultants and Advisors: Deliver precise valuation insights for clients interested in Guangdong Hec Technology (600673SS).
- Students and Educators: Utilize real-world data to enhance financial modeling skills and education.
- Tech Enthusiasts: Gain insights into the valuation of technology firms like Guangdong Hec Technology (600673SS) in the market.
What the Template Contains
- Historical Data: Provides Guangdong Hec Technologyholding Co., Ltd's (600673SS) past financials and foundational forecasts.
- DCF and Levered DCF Models: Comprehensive templates for calculating the intrinsic value of Guangdong Hec Technologyholding Co., Ltd (600673SS).
- WACC Sheet: Pre-configured calculations for the Weighted Average Cost of Capital.
- Editable Inputs: Adjust primary drivers such as growth rates, EBITDA %, and CAPEX assumptions.
- Quarterly and Annual Statements: A thorough breakdown of Guangdong Hec Technologyholding Co., Ltd's (600673SS) financials.
- Interactive Dashboard: Dynamically visualize valuation results and projections.
Disclaimer
All information, articles, and product details provided on this website are for general informational and educational purposes only. We do not claim any ownership over, nor do we intend to infringe upon, any trademarks, copyrights, logos, brand names, or other intellectual property mentioned or depicted on this site. Such intellectual property remains the property of its respective owners, and any references here are made solely for identification or informational purposes, without implying any affiliation, endorsement, or partnership.
We make no representations or warranties, express or implied, regarding the accuracy, completeness, or suitability of any content or products presented. Nothing on this website should be construed as legal, tax, investment, financial, medical, or other professional advice. In addition, no part of this site—including articles or product references—constitutes a solicitation, recommendation, endorsement, advertisement, or offer to buy or sell any securities, franchises, or other financial instruments, particularly in jurisdictions where such activity would be unlawful.
All content is of a general nature and may not address the specific circumstances of any individual or entity. It is not a substitute for professional advice or services. Any actions you take based on the information provided here are strictly at your own risk. You accept full responsibility for any decisions or outcomes arising from your use of this website and agree to release us from any liability in connection with your use of, or reliance upon, the content or products found herein.