
|
Nanjing Pharmaceutical Company Limited (600713.SS) Avaliação DCF |
Totalmente Editável: Adapte-Se Às Suas Necessidades No Excel Ou Planilhas
Design Profissional: Modelos Confiáveis E Padrão Da Indústria
Pré-Construídos Para Uso Rápido E Eficiente
Compatível com MAC/PC, totalmente desbloqueado
Não É Necessária Experiência; Fácil De Seguir
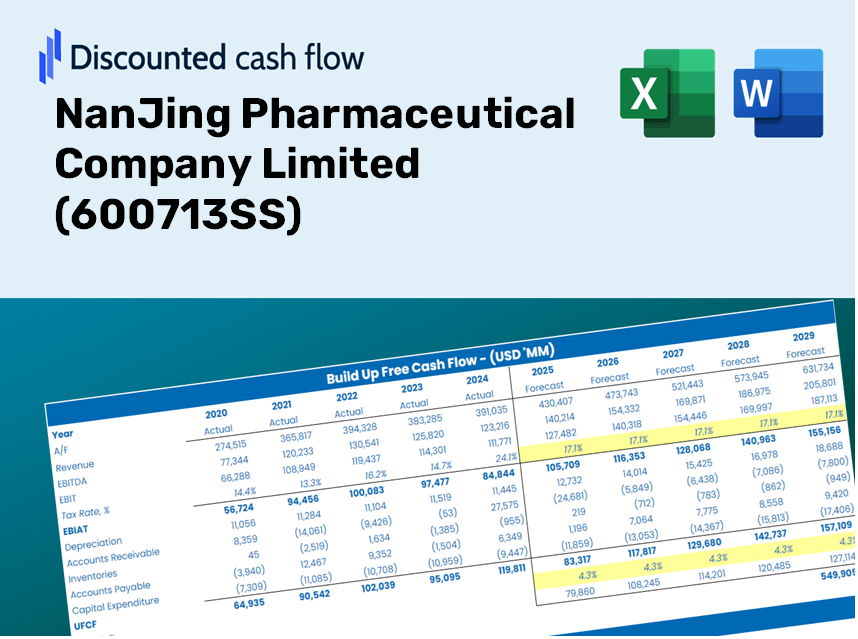
NanJing Pharmaceutical Company Limited (600713.SS) Bundle
Procurando avaliar o valor intrínseco da Nanjing Pharmaceutical Company Limited? Nossa calculadora DCF (600713SS) integra dados do mundo real com extensas opções de personalização, permitindo refinar suas previsões e fazer escolhas de investimento mais informadas.
Discounted Cash Flow (DCF) - (USD MM)
| Year | AY1 2020 |
AY2 2021 |
AY3 2022 |
AY4 2023 |
AY5 2024 |
FY1 2025 |
FY2 2026 |
FY3 2027 |
FY4 2028 |
FY5 2029 |
|---|---|---|---|---|---|---|---|---|---|---|
| Revenue | 39,817.4 | 45,123.2 | 50,221.6 | 53,589.7 | 53,696.2 | 57,928.7 | 62,494.8 | 67,420.9 | 72,735.3 | 78,468.5 |
| Revenue Growth, % | 0 | 13.33 | 11.3 | 6.71 | 0.19875 | 7.88 | 7.88 | 7.88 | 7.88 | 7.88 |
| EBITDA | 1,165.8 | 1,548.0 | 1,622.9 | 1,619.3 | 1,673.8 | 1,822.3 | 1,966.0 | 2,120.9 | 2,288.1 | 2,468.5 |
| EBITDA, % | 2.93 | 3.43 | 3.23 | 3.02 | 3.12 | 3.15 | 3.15 | 3.15 | 3.15 | 3.15 |
| Depreciation | 135.8 | 251.2 | 269.8 | 270.4 | 136.5 | 254.2 | 274.2 | 295.8 | 319.2 | 344.3 |
| Depreciation, % | 0.34109 | 0.55676 | 0.53729 | 0.50457 | 0.25426 | 0.43879 | 0.43879 | 0.43879 | 0.43879 | 0.43879 |
| EBIT | 1,030.0 | 1,296.8 | 1,353.1 | 1,348.9 | 1,537.2 | 1,568.1 | 1,691.7 | 1,825.1 | 1,968.9 | 2,124.1 |
| EBIT, % | 2.59 | 2.87 | 2.69 | 2.52 | 2.86 | 2.71 | 2.71 | 2.71 | 2.71 | 2.71 |
| Total Cash | 1,478.7 | 2,093.3 | 2,327.2 | 2,371.6 | 4,562.6 | 3,001.8 | 3,238.4 | 3,493.7 | 3,769.0 | 4,066.1 |
| Total Cash, percent | .0 | .0 | .0 | .0 | .0 | .0 | .0 | .0 | .0 | .0 |
| Account Receivables | 14,261.6 | 15,251.4 | 19,802.4 | 16,208.6 | 15,909.8 | 19,570.8 | 21,113.5 | 22,777.7 | 24,573.2 | 26,510.1 |
| Account Receivables, % | 35.82 | 33.8 | 39.43 | 30.25 | 29.63 | 33.78 | 33.78 | 33.78 | 33.78 | 33.78 |
| Inventories | 4,065.5 | 4,517.8 | 5,787.3 | 5,798.0 | 6,285.9 | 6,287.8 | 6,783.4 | 7,318.1 | 7,894.9 | 8,517.2 |
| Inventories, % | 10.21 | 10.01 | 11.52 | 10.82 | 11.71 | 10.85 | 10.85 | 10.85 | 10.85 | 10.85 |
| Accounts Payable | 7,633.7 | 8,064.1 | 10,130.9 | 9,693.6 | 10,175.6 | 10,920.1 | 11,780.8 | 12,709.4 | 13,711.2 | 14,792.0 |
| Accounts Payable, % | 19.17 | 17.87 | 20.17 | 18.09 | 18.95 | 18.85 | 18.85 | 18.85 | 18.85 | 18.85 |
| Capital Expenditure | -247.0 | -306.5 | -155.3 | -158.2 | -544.8 | -338.1 | -364.8 | -393.5 | -424.6 | -458.0 |
| Capital Expenditure, % | -0.62026 | -0.67934 | -0.30919 | -0.29524 | -1.01 | -0.58371 | -0.58371 | -0.58371 | -0.58371 | -0.58371 |
| Tax Rate, % | 43.13 | 43.13 | 43.13 | 43.13 | 43.13 | 43.13 | 43.13 | 43.13 | 43.13 | 43.13 |
| EBITAT | 572.0 | 780.9 | 889.6 | 796.9 | 874.2 | 932.9 | 1,006.4 | 1,085.7 | 1,171.3 | 1,263.7 |
| Depreciation | ||||||||||
| Changes in Account Receivables | ||||||||||
| Changes in Inventories | ||||||||||
| Changes in Accounts Payable | ||||||||||
| Capital Expenditure | ||||||||||
| UFCF | -10,232.5 | -286.0 | -2,749.6 | 4,054.9 | 758.9 | -2,069.5 | -261.7 | -282.3 | -304.5 | -328.5 |
| WACC, % | 5.72 | 5.9 | 6.1 | 5.85 | 5.77 | 5.87 | 5.87 | 5.87 | 5.87 | 5.87 |
| PV UFCF | ||||||||||
| SUM PV UFCF | -2,915.6 | |||||||||
| Long Term Growth Rate, % | 3.00 | |||||||||
| Free cash flow (T + 1) | -338 | |||||||||
| Terminal Value | -11,797 | |||||||||
| Present Terminal Value | -8,871 | |||||||||
| Enterprise Value | -11,786 | |||||||||
| Net Debt | 2,937 | |||||||||
| Equity Value | -14,723 | |||||||||
| Diluted Shares Outstanding, MM | 1,303 | |||||||||
| Equity Value Per Share | -11.30 |
What You Will Receive
- Adjustable Forecast Inputs: Modify key assumptions (growth %, margins, WACC) effortlessly to explore different scenarios.
- Comprehensive Data: NanJing Pharmaceutical Company Limited’s financial information pre-included to kickstart your analysis.
- Automated DCF Calculations: The template computes Net Present Value (NPV) and intrinsic value automatically for your convenience.
- Versatile and Professional Design: A refined Excel model tailored to meet your valuation requirements.
- Designed for Analysts and Investors: Perfect for evaluating projections, validating strategies, and enhancing efficiency.
Key Features
- Authentic Financial Data: Gain access to precise pre-loaded historical figures and forward-looking estimates for NanJing Pharmaceutical Company Limited (600713SS).
- Personalizable Forecast Inputs: Modify the highlighted yellow cells, including WACC, growth rates, and profit margins.
- Real-time Calculations: Automatic refresh of DCF, Net Present Value (NPV), and cash flow assessments.
- User-Friendly Dashboard: Clear charts and summaries to help visualize your valuation outcomes.
- Designed for All Skill Levels: A straightforward and intuitive layout ideal for investors, CFOs, and consultants alike.
How It Works
- 1. Access the Template: Download and open the Excel file featuring NanJing Pharmaceutical Company Limited’s (600713SS) preloaded data.
- 2. Adjust Assumptions: Modify essential parameters such as growth rates, WACC, and capital expenditures.
- 3. Observe Results Instantly: The DCF model automatically computes intrinsic value and NPV.
- 4. Explore Scenarios: Analyze various forecasts to evaluate different valuation outcomes.
- 5. Utilize with Assurance: Present polished valuation insights to bolster your decision-making process.
Why Opt for This Calculator?
- User-Friendly Interface: Tailored for both novices and seasoned users.
- Customizable Inputs: Easily adjust parameters to align with your analysis.
- Real-Time Updates: Witness immediate changes in NanJing Pharmaceutical's valuation as you modify inputs.
- Preloaded Data: Comes equipped with NanJing Pharmaceutical's actual financial figures for swift evaluation.
- Favored by Experts: Employed by analysts and investors for making informed choices.
Who Can Benefit from This Product?
- Investors: Make informed choices with a sophisticated valuation tool tailored for your needs.
- Financial Analysts: Enhance efficiency with a customizable DCF model that's ready to use.
- Consultants: Easily modify the template for impactful client presentations or detailed reports.
- Finance Enthusiasts: Expand your knowledge of valuation methods through practical, real-world applications.
- Educators and Students: Leverage it as a hands-on resource in finance education and coursework.
Contents of the Template
- Preloaded NJPH Data: Historical and forecasted financial data, encompassing revenue, EBIT, and capital investments.
- DCF and WACC Models: Advanced templates for assessing intrinsic value and calculating Weighted Average Cost of Capital.
- Editable Inputs: Cells highlighted in yellow for modifying revenue growth rates, tax percentages, and discount rates.
- Financial Statements: Detailed annual and quarterly financial statements for thorough analysis.
- Key Ratios: Ratios related to profitability, leverage, and efficiency to assess company performance.
- Dashboard and Charts: Visual representations of valuation results and underlying assumptions.
Disclaimer
All information, articles, and product details provided on this website are for general informational and educational purposes only. We do not claim any ownership over, nor do we intend to infringe upon, any trademarks, copyrights, logos, brand names, or other intellectual property mentioned or depicted on this site. Such intellectual property remains the property of its respective owners, and any references here are made solely for identification or informational purposes, without implying any affiliation, endorsement, or partnership.
We make no representations or warranties, express or implied, regarding the accuracy, completeness, or suitability of any content or products presented. Nothing on this website should be construed as legal, tax, investment, financial, medical, or other professional advice. In addition, no part of this site—including articles or product references—constitutes a solicitation, recommendation, endorsement, advertisement, or offer to buy or sell any securities, franchises, or other financial instruments, particularly in jurisdictions where such activity would be unlawful.
All content is of a general nature and may not address the specific circumstances of any individual or entity. It is not a substitute for professional advice or services. Any actions you take based on the information provided here are strictly at your own risk. You accept full responsibility for any decisions or outcomes arising from your use of this website and agree to release us from any liability in connection with your use of, or reliance upon, the content or products found herein.