
|
Shanghai Aiko Solar Energy Co., Ltd. (600732.SS) DCF Avaliação |
Totalmente Editável: Adapte-Se Às Suas Necessidades No Excel Ou Planilhas
Design Profissional: Modelos Confiáveis E Padrão Da Indústria
Pré-Construídos Para Uso Rápido E Eficiente
Compatível com MAC/PC, totalmente desbloqueado
Não É Necessária Experiência; Fácil De Seguir
Shanghai Aiko Solar Energy Co., Ltd. (600732.SS) Bundle
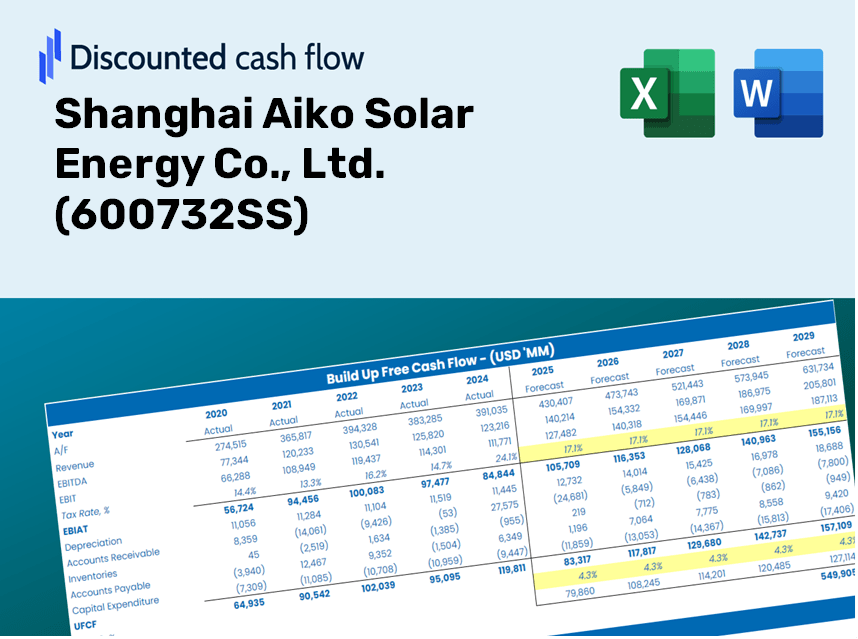
Avalie as perspectivas financeiras da Shanghai Aiko Solar Energy Co., Ltd. (600732Ss) com precisão profissional! Esta calculadora (600732SS) DCF é pré-carregada com dados financeiros e oferece total flexibilidade para modificar o crescimento da receita, WACC, margens e outras suposições críticas para se alinhar às suas previsões.
What You Will Receive
- Authentic Aiko Data: Comprehensive financial metrics – from revenue to EBIT – grounded in actual and projected figures.
- Complete Customization: Modify all essential parameters (highlighted in yellow) such as WACC, growth %, and tax rates.
- Immediate Valuation Adjustments: Automatic recalculations to assess how changes affect the fair value of Shanghai Aiko Solar Energy Co., Ltd. (600732SS).
- Flexible Excel Template: Designed for easy modifications, scenario analysis, and thorough projections.
- Efficient and Precise: Eliminate the need to create models from scratch while ensuring accuracy and adaptability.
Key Features
- Comprehensive DCF Calculator: Offers detailed unlevered and levered DCF valuation models tailored for Shanghai Aiko Solar Energy Co., Ltd. (600732SS).
- WACC Calculator: Features a pre-configured Weighted Average Cost of Capital sheet with customizable parameters.
- Adjustable Forecast Assumptions: Easily modify growth rates, capital expenditures, and discount rates to suit your analysis.
- Integrated Financial Ratios: Evaluate profitability, leverage, and efficiency ratios specific to Shanghai Aiko Solar Energy Co., Ltd. (600732SS).
- Visual Dashboard and Charts: Graphical representations highlight key valuation metrics for streamlined analysis.
How It Works
- Step 1: Download the prebuilt Excel template containing Shanghai Aiko Solar Energy Co., Ltd.'s (600732SS) data.
- Step 2: Review the pre-filled sheets to familiarize yourself with the essential metrics.
- Step 3: Modify forecasts and assumptions in the editable yellow cells (WACC, growth rates, margins).
- Step 4: Quickly view the recalculated results, including the intrinsic value of Shanghai Aiko Solar Energy Co., Ltd. (600732SS).
- Step 5: Utilize the outputs to make informed investment choices or create detailed reports.
Why Opt for This Calculator?
- Reliable Data: Authentic Shanghai Aiko Solar Energy Co., Ltd. (600732SS) financials provide trustworthy valuation outcomes.
- Tailorable: Modify essential parameters such as growth rates, WACC, and tax rates to align with your forecasts.
- Efficiency Boost: Pre-configured calculations save you the hassle of starting from the beginning.
- Expert-Level Tool: Crafted for investors, analysts, and consultants alike.
- Accessible: User-friendly design and detailed instructions simplify the process for everyone.
Who Can Benefit from This Product?
- Individual Investors: Gain insights to make informed decisions regarding the purchase or sale of Shanghai Aiko Solar Energy Co., Ltd. (600732SS) stock.
- Financial Analysts: Enhance valuation analysis with efficient, ready-to-deploy financial models specific to the solar energy sector.
- Consultants: Provide clients with accurate and timely valuation assessments for Shanghai Aiko Solar Energy Co., Ltd. (600732SS).
- Business Owners: Learn how large companies like Shanghai Aiko Solar Energy Co., Ltd. (600732SS) are valued to inform your business strategies.
- Finance Students: Acquire hands-on experience in valuation techniques using data and case studies from the solar energy market.
What the Template Contains
- Historical Data: Encompasses Shanghai Aiko Solar Energy Co., Ltd.'s past financial performance and foundational forecasts.
- DCF and Levered DCF Models: Comprehensive templates designed to evaluate the intrinsic value of Shanghai Aiko Solar Energy Co., Ltd. (600732SS).
- WACC Sheet: Ready-to-use calculations for the Weighted Average Cost of Capital.
- Editable Inputs: Customize key variables such as growth rates, EBITDA %, and CAPEX forecasts.
- Quarterly and Annual Statements: An exhaustive analysis of Shanghai Aiko Solar Energy Co., Ltd.'s financial reports.
- Interactive Dashboard: Dynamically visualize valuation outcomes and future projections.
Disclaimer
All information, articles, and product details provided on this website are for general informational and educational purposes only. We do not claim any ownership over, nor do we intend to infringe upon, any trademarks, copyrights, logos, brand names, or other intellectual property mentioned or depicted on this site. Such intellectual property remains the property of its respective owners, and any references here are made solely for identification or informational purposes, without implying any affiliation, endorsement, or partnership.
We make no representations or warranties, express or implied, regarding the accuracy, completeness, or suitability of any content or products presented. Nothing on this website should be construed as legal, tax, investment, financial, medical, or other professional advice. In addition, no part of this site—including articles or product references—constitutes a solicitation, recommendation, endorsement, advertisement, or offer to buy or sell any securities, franchises, or other financial instruments, particularly in jurisdictions where such activity would be unlawful.
All content is of a general nature and may not address the specific circumstances of any individual or entity. It is not a substitute for professional advice or services. Any actions you take based on the information provided here are strictly at your own risk. You accept full responsibility for any decisions or outcomes arising from your use of this website and agree to release us from any liability in connection with your use of, or reliance upon, the content or products found herein.