
|
Changchun Faway Automobile Components Co., Ltd (600742.SS) Avaliação DCF |
Totalmente Editável: Adapte-Se Às Suas Necessidades No Excel Ou Planilhas
Design Profissional: Modelos Confiáveis E Padrão Da Indústria
Pré-Construídos Para Uso Rápido E Eficiente
Compatível com MAC/PC, totalmente desbloqueado
Não É Necessária Experiência; Fácil De Seguir
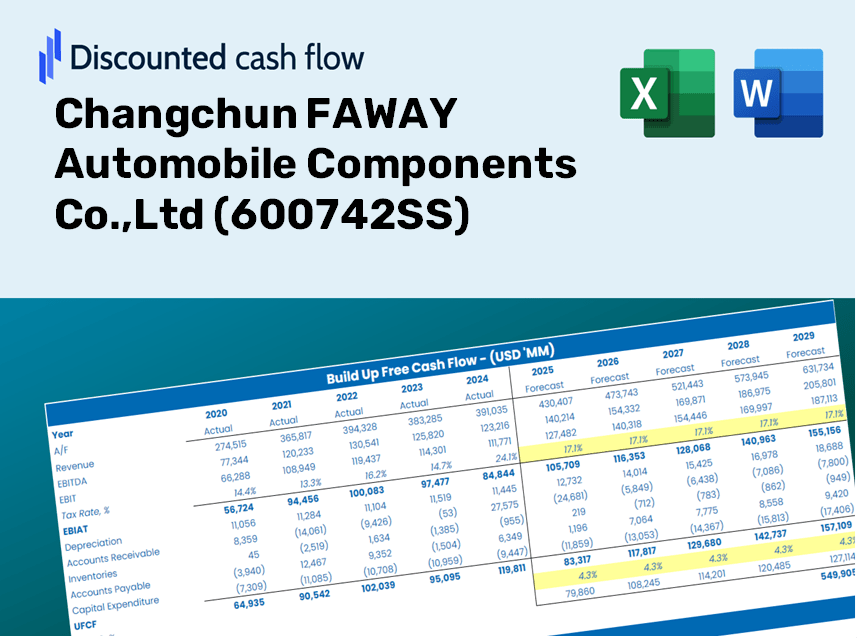
Changchun FAWAY Automobile Components Co.,Ltd (600742.SS) Bundle
Ganhe domínio sobre o seu Changchun Faway Automobile Components Co., Ltd (600742SS) Analysis usando nossa sofisticada calculadora DCF! Este modelo do Excel é pré -carregado com dados reais (600742Ss), permitindo que você ajuste as previsões e suposições para calcular com precisão o valor intrínseco da Changchun Faway Automobile Components Co., Ltd.
Discounted Cash Flow (DCF) - (USD MM)
| Year | AY1 2020 |
AY2 2021 |
AY3 2022 |
AY4 2023 |
AY5 2024 |
FY1 2025 |
FY2 2026 |
FY3 2027 |
FY4 2028 |
FY5 2029 |
|---|---|---|---|---|---|---|---|---|---|---|
| Revenue | 19,520.0 | 20,537.4 | 19,971.6 | 20,765.5 | 19,636.3 | 20,837.0 | 22,111.1 | 23,463.1 | 24,897.8 | 26,420.2 |
| Revenue Growth, % | 0 | 5.21 | -2.75 | 3.97 | -5.44 | 6.11 | 6.11 | 6.11 | 6.11 | 6.11 |
| EBITDA | 1,615.3 | 1,730.3 | 1,588.0 | 1,519.8 | 1,104.8 | 1,566.8 | 1,662.6 | 1,764.3 | 1,872.2 | 1,986.6 |
| EBITDA, % | 8.28 | 8.42 | 7.95 | 7.32 | 5.63 | 7.52 | 7.52 | 7.52 | 7.52 | 7.52 |
| Depreciation | 626.2 | 730.6 | 709.0 | 751.4 | 626.9 | 713.7 | 757.3 | 803.7 | 852.8 | 904.9 |
| Depreciation, % | 3.21 | 3.56 | 3.55 | 3.62 | 3.19 | 3.43 | 3.43 | 3.43 | 3.43 | 3.43 |
| EBIT | 989.2 | 999.7 | 879.0 | 768.4 | 478.0 | 853.1 | 905.3 | 960.6 | 1,019.4 | 1,081.7 |
| EBIT, % | 5.07 | 4.87 | 4.4 | 3.7 | 2.43 | 4.09 | 4.09 | 4.09 | 4.09 | 4.09 |
| Total Cash | 4,236.4 | 5,603.1 | 5,994.3 | 7,452.3 | 9,449.9 | 6,793.3 | 7,208.7 | 7,649.5 | 8,117.2 | 8,613.6 |
| Total Cash, percent | .0 | .0 | .0 | .0 | .0 | .0 | .0 | .0 | .0 | .0 |
| Account Receivables | 5,408.0 | 5,357.2 | 5,059.0 | 5,666.3 | 5,931.9 | 5,693.4 | 6,041.5 | 6,410.9 | 6,802.9 | 7,218.9 |
| Account Receivables, % | 27.71 | 26.09 | 25.33 | 27.29 | 30.21 | 27.32 | 27.32 | 27.32 | 27.32 | 27.32 |
| Inventories | 490.0 | 487.9 | 565.8 | 471.3 | 476.3 | 517.4 | 549.0 | 582.6 | 618.2 | 656.0 |
| Inventories, % | 2.51 | 2.38 | 2.83 | 2.27 | 2.43 | 2.48 | 2.48 | 2.48 | 2.48 | 2.48 |
| Accounts Payable | 7,958.4 | 6,292.4 | 8,182.5 | 9,275.8 | 9,552.3 | 8,572.2 | 9,096.3 | 9,652.5 | 10,242.7 | 10,869.0 |
| Accounts Payable, % | 40.77 | 30.64 | 40.97 | 44.67 | 48.65 | 41.14 | 41.14 | 41.14 | 41.14 | 41.14 |
| Capital Expenditure | -670.1 | -653.4 | -921.7 | -763.5 | -770.7 | -784.7 | -832.7 | -883.7 | -937.7 | -995.0 |
| Capital Expenditure, % | -3.43 | -3.18 | -4.61 | -3.68 | -3.92 | -3.77 | -3.77 | -3.77 | -3.77 | -3.77 |
| Tax Rate, % | 50.83 | 50.83 | 50.83 | 50.83 | 50.83 | 50.83 | 50.83 | 50.83 | 50.83 | 50.83 |
| EBITAT | 869.4 | 890.2 | 798.6 | 440.0 | 235.0 | 638.5 | 677.6 | 719.0 | 762.9 | 809.6 |
| Depreciation | ||||||||||
| Changes in Account Receivables | ||||||||||
| Changes in Inventories | ||||||||||
| Changes in Accounts Payable | ||||||||||
| Capital Expenditure | ||||||||||
| UFCF | 2,885.8 | -645.6 | 2,696.2 | 1,008.4 | 97.1 | -215.2 | 746.6 | 792.2 | 840.6 | 892.0 |
| WACC, % | 5.86 | 5.87 | 5.88 | 5.7 | 5.66 | 5.8 | 5.8 | 5.8 | 5.8 | 5.8 |
| PV UFCF | ||||||||||
| SUM PV UFCF | 2,476.8 | |||||||||
| Long Term Growth Rate, % | 0.50 | |||||||||
| Free cash flow (T + 1) | 897 | |||||||||
| Terminal Value | 16,931 | |||||||||
| Present Terminal Value | 12,775 | |||||||||
| Enterprise Value | 15,252 | |||||||||
| Net Debt | -8,104 | |||||||||
| Equity Value | 23,356 | |||||||||
| Diluted Shares Outstanding, MM | 743 | |||||||||
| Equity Value Per Share | 31.43 |
What You Will Receive
- Customizable Excel Template: A fully adjustable Excel-based DCF Calculator featuring pre-populated financial data for Changchun FAWAY Automobile Components Co., Ltd (600742SS).
- Authentic Market Data: Access to historical performance metrics and forward-looking projections (highlighted in the yellow cells).
- Adjustable Forecasting: Modify key forecast parameters such as revenue growth, EBITDA margins, and WACC.
- Real-Time Calculations: Instantly visualize how your assumptions affect the valuation of Changchun FAWAY Automobile Components Co., Ltd (600742SS).
- Professional-Grade Tool: Designed for investors, CFOs, consultants, and financial analysts in the automotive sector.
- Intuitive User Interface: Organized for ease of understanding and interaction, complete with step-by-step guidance.
Key Features
- Pre-Loaded Data: Historical financial statements and pre-filled forecasts for Changchun FAWAY Automobile Components Co.,Ltd (600742SS).
- Fully Adjustable Inputs: Customize WACC, tax rates, revenue growth, and EBITDA margins.
- Instant Results: View the intrinsic value of Changchun FAWAY recalculating in real time.
- Clear Visual Outputs: Dashboard charts present valuation results and essential metrics.
- Built for Accuracy: A professional tool tailored for analysts, investors, and finance professionals.
How It Functions
- Download: Obtain the pre-configured Excel file containing financial data for Changchun FAWAY Automobile Components Co., Ltd (600742SS).
- Customize: Modify projections, such as revenue growth, EBITDA margin, and WACC.
- Update Automatically: The intrinsic value and NPV calculations refresh in real-time.
- Test Scenarios: Develop various projections and instantly compare the results.
- Make Decisions: Utilize the valuation findings to inform your investment approach.
Why Choose This Calculator for Changchun FAWAY Automobile Components Co., Ltd (600742SS)?
- All-in-One Solution: Combines DCF, WACC, and financial ratio analyses in a single tool.
- Customizable Variables: Modify the yellow-highlighted cells to explore different scenarios.
- Comprehensive Analysis: Automatically computes the intrinsic value and Net Present Value for Changchun FAWAY.
- Ready-to-Use Data: Includes historical and projected data for reliable baseline assessments.
- High-Caliber Tool: Perfect for financial analysts, investors, and business consultants focused on (600742SS).
Who Can Benefit from Changchun FAWAY Automobile Components Co., Ltd (600742SS)?
- Investors: Equip yourself with a reliable valuation tool to make informed investment choices.
- Financial Analysts: Streamline your workflow with an easily customizable DCF model.
- Consultants: Efficiently modify the template for impactful client presentations or reports.
- Automotive Enthusiasts: Enhance your insights into valuation methods through practical, industry-specific examples.
- Educators and Students: Leverage this resource as a hands-on learning aid in finance and automotive-related studies.
Contents of the Template
- Operating and Balance Sheet Data: Pre-filled historical data and forecasts for Changchun FAWAY Automobile Components Co., Ltd (600742SS), including metrics such as revenue, EBITDA, EBIT, and capital expenditures.
- WACC Calculation: A dedicated sheet for calculating the Weighted Average Cost of Capital (WACC), featuring parameters like Beta, risk-free rate, and share price.
- DCF Valuation (Unlevered and Levered): Customizable Discounted Cash Flow models that provide intrinsic value alongside detailed calculations.
- Financial Statements: Pre-loaded annual and quarterly financial statements to facilitate in-depth analysis.
- Key Ratios: Offers key profitability, leverage, and efficiency ratios specific to Changchun FAWAY Automobile Components Co., Ltd (600742SS).
- Dashboard and Charts: An interactive visual summary of valuation outputs and assumptions, designed for easy result analysis.
Disclaimer
All information, articles, and product details provided on this website are for general informational and educational purposes only. We do not claim any ownership over, nor do we intend to infringe upon, any trademarks, copyrights, logos, brand names, or other intellectual property mentioned or depicted on this site. Such intellectual property remains the property of its respective owners, and any references here are made solely for identification or informational purposes, without implying any affiliation, endorsement, or partnership.
We make no representations or warranties, express or implied, regarding the accuracy, completeness, or suitability of any content or products presented. Nothing on this website should be construed as legal, tax, investment, financial, medical, or other professional advice. In addition, no part of this site—including articles or product references—constitutes a solicitation, recommendation, endorsement, advertisement, or offer to buy or sell any securities, franchises, or other financial instruments, particularly in jurisdictions where such activity would be unlawful.
All content is of a general nature and may not address the specific circumstances of any individual or entity. It is not a substitute for professional advice or services. Any actions you take based on the information provided here are strictly at your own risk. You accept full responsibility for any decisions or outcomes arising from your use of this website and agree to release us from any liability in connection with your use of, or reliance upon, the content or products found herein.