
|
XIAMEN ITG GROUP CORP., LTD (600755.SS) Avaliação DCF |
Totalmente Editável: Adapte-Se Às Suas Necessidades No Excel Ou Planilhas
Design Profissional: Modelos Confiáveis E Padrão Da Indústria
Pré-Construídos Para Uso Rápido E Eficiente
Compatível com MAC/PC, totalmente desbloqueado
Não É Necessária Experiência; Fácil De Seguir
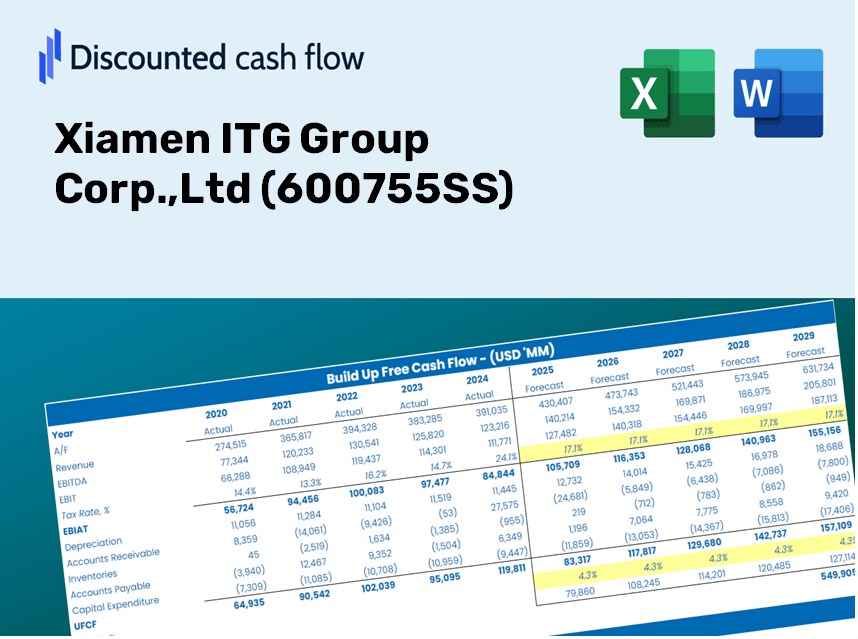
Xiamen ITG Group Corp.,Ltd (600755.SS) Bundle
Maximize a eficiência e melhore a precisão com a calculadora DCF (600755Ss)! Utilizando dados atualizados da XIAMEN ITG GROUP Corp., LTD e suposições personalizáveis, essa ferramenta permite que você preveja, analise e valorize o XIAMEN ITG como um investidor experiente.
Discounted Cash Flow (DCF) - (USD MM)
| Year | AY1 2020 |
AY2 2021 |
AY3 2022 |
AY4 2023 |
AY5 2024 |
FY1 2025 |
FY2 2026 |
FY3 2027 |
FY4 2028 |
FY5 2029 |
|---|---|---|---|---|---|---|---|---|---|---|
| Revenue | 351,088.9 | 464,755.6 | 521,945.0 | 468,246.9 | 354,439.6 | 378,795.3 | 404,824.6 | 432,642.5 | 462,372.0 | 494,144.4 |
| Revenue Growth, % | 0 | 32.38 | 12.31 | -10.29 | -24.3 | 6.87 | 6.87 | 6.87 | 6.87 | 6.87 |
| EBITDA | 3,752.6 | 4,854.2 | 5,348.8 | 2,802.4 | 556.2 | 2,949.7 | 3,152.4 | 3,369.0 | 3,600.5 | 3,847.9 |
| EBITDA, % | 1.07 | 1.04 | 1.02 | 0.59848 | 0.15693 | 0.7787 | 0.7787 | 0.7787 | 0.7787 | 0.7787 |
| Depreciation | 224.3 | 249.8 | 300.2 | 399.8 | 475.7 | 299.1 | 319.6 | 341.6 | 365.1 | 390.1 |
| Depreciation, % | 0.06388566 | 0.05374566 | 0.05751973 | 0.08538724 | 0.13422 | 0.07895209 | 0.07895209 | 0.07895209 | 0.07895209 | 0.07895209 |
| EBIT | 3,528.3 | 4,604.4 | 5,048.6 | 2,402.6 | 80.5 | 2,650.6 | 2,832.7 | 3,027.4 | 3,235.4 | 3,457.8 |
| EBIT, % | 1 | 0.99071 | 0.96726 | 0.5131 | 0.02271091 | 0.69975 | 0.69975 | 0.69975 | 0.69975 | 0.69975 |
| Total Cash | 16,085.5 | 15,074.6 | 20,908.1 | 15,974.9 | 11,889.5 | 14,089.0 | 15,057.1 | 16,091.8 | 17,197.5 | 18,379.3 |
| Total Cash, percent | .0 | .0 | .0 | .0 | .0 | .0 | .0 | .0 | .0 | .0 |
| Account Receivables | 4,742.3 | 7,170.0 | 11,417.4 | 15,426.1 | 17,828.2 | 10,155.8 | 10,853.6 | 11,599.5 | 12,396.5 | 13,248.4 |
| Account Receivables, % | 1.35 | 1.54 | 2.19 | 3.29 | 5.03 | 2.68 | 2.68 | 2.68 | 2.68 | 2.68 |
| Inventories | 49,953.3 | 31,351.6 | 29,265.9 | 31,608.0 | 25,647.5 | 30,733.5 | 32,845.3 | 35,102.3 | 37,514.4 | 40,092.3 |
| Inventories, % | 14.23 | 6.75 | 5.61 | 6.75 | 7.24 | 8.11 | 8.11 | 8.11 | 8.11 | 8.11 |
| Accounts Payable | 4,386.3 | 19,699.6 | 25,117.6 | 31,058.8 | 28,134.0 | 18,842.0 | 20,136.7 | 21,520.5 | 22,999.3 | 24,579.7 |
| Accounts Payable, % | 1.25 | 4.24 | 4.81 | 6.63 | 7.94 | 4.97 | 4.97 | 4.97 | 4.97 | 4.97 |
| Capital Expenditure | -691.7 | -515.9 | -1,240.6 | -2,302.8 | -1,509.4 | -1,108.6 | -1,184.8 | -1,266.2 | -1,353.2 | -1,446.2 |
| Capital Expenditure, % | -0.197 | -0.111 | -0.23769 | -0.49178 | -0.42586 | -0.29267 | -0.29267 | -0.29267 | -0.29267 | -0.29267 |
| Tax Rate, % | -37.76 | -37.76 | -37.76 | -37.76 | -37.76 | -37.76 | -37.76 | -37.76 | -37.76 | -37.76 |
| EBITAT | 2,475.0 | 3,102.9 | 3,189.6 | 1,803.2 | 110.9 | 1,992.0 | 2,128.9 | 2,275.2 | 2,431.5 | 2,598.6 |
| Depreciation | ||||||||||
| Changes in Account Receivables | ||||||||||
| Changes in Inventories | ||||||||||
| Changes in Accounts Payable | ||||||||||
| Capital Expenditure | ||||||||||
| UFCF | -48,301.6 | 34,324.1 | 5,505.5 | -509.4 | -289.1 | -5,523.1 | -251.3 | -268.5 | -287.0 | -306.7 |
| WACC, % | 9.38 | 9.35 | 9.31 | 9.42 | 9.67 | 9.43 | 9.43 | 9.43 | 9.43 | 9.43 |
| PV UFCF | ||||||||||
| SUM PV UFCF | -5,857.8 | |||||||||
| Long Term Growth Rate, % | 2.00 | |||||||||
| Free cash flow (T + 1) | -313 | |||||||||
| Terminal Value | -4,213 | |||||||||
| Present Terminal Value | -2,686 | |||||||||
| Enterprise Value | -8,543 | |||||||||
| Net Debt | 3,980 | |||||||||
| Equity Value | -12,523 | |||||||||
| Diluted Shares Outstanding, MM | 20,855 | |||||||||
| Equity Value Per Share | -0.60 |
Benefits You Will Receive
- Genuine Xiamen ITG Data: Preloaded financial metrics – encompassing revenue and EBIT – derived from both actual and forecasted data.
- Complete Customization: Modify all key variables (highlighted cells) such as WACC, growth rate, and tax percentages.
- Immediate Valuation Adjustments: Automatic recalculations to assess the effects of changes on Xiamen ITG’s fair value.
- Flexible Excel Template: Designed for easy modifications, scenario analyses, and comprehensive projections.
- Efficient and Precise: Avoid the hassle of creating models from the ground up while ensuring accuracy and adaptability.
Key Features
- Comprehensive DCF Calculator: Offers both unlevered and levered DCF valuation models tailored for Xiamen ITG Group Corp.,Ltd (600755SS).
- WACC Calculator: Features a pre-designed Weighted Average Cost of Capital sheet with adjustable parameters.
- Customizable Forecast Assumptions: Easily update growth rates, capital expenditures, and discount rates.
- Integrated Financial Ratios: Evaluate profitability, leverage, and efficiency ratios specifically for Xiamen ITG Group Corp.,Ltd (600755SS).
- Interactive Dashboard and Charts: Visual representations highlight key valuation metrics for swift analysis.
How It Functions
- Step 1: Download the Excel file.
- Step 2: Examine the pre-filled data for Xiamen ITG Group Corp., Ltd (600755SS) (historical and forecasted).
- Step 3: Modify key assumptions (highlighted in yellow) based on your insights.
- Step 4: Observe the automatic adjustments reflecting Xiamen ITG's intrinsic value.
- Step 5: Utilize the results for investment strategies or reporting purposes.
Why Select This Calculator for Xiamen ITG Group Corp., Ltd (600755SS)?
- Designed for Experts: A sophisticated tool tailored for analysts, CFOs, and consultants.
- Accurate Financial Data: Historical and projected financials for Xiamen ITG preloaded for precision.
- Scenario Simulation: Effortlessly model various forecasts and assumptions.
- Transparent Outputs: Automatically generates intrinsic value, NPV, and essential metrics.
- User-Friendly: Clear, step-by-step instructions to facilitate your calculations.
Who Can Benefit from Xiamen ITG Group Corp., Ltd (600755SS) Products?
- Investors: Empower your investment decisions with our advanced valuation tools.
- Financial Analysts: Streamline your workflow with a customizable, ready-to-use DCF model.
- Consultants: Effortlessly tailor the template to enhance client presentations or reports.
- Finance Enthusiasts: Explore real-world examples to enhance your grasp of valuation methods.
- Educators and Students: Utilize our resources as hands-on learning materials in finance courses.
Contents of the Template
- Pre-Filled Data: Contains historical financials and projections for Xiamen ITG Group Corp., Ltd (600755SS).
- Discounted Cash Flow Model: An editable DCF valuation model with automatic calculation features.
- Weighted Average Cost of Capital (WACC): A dedicated worksheet for WACC calculations based on customized inputs.
- Key Financial Ratios: Assess profitability, efficiency, and leverage for Xiamen ITG Group Corp., Ltd (600755SS).
- Customizable Inputs: Easily modify revenue growth rates, margins, and tax rates.
- Clear Dashboard: Visualizations and tables that summarize essential valuation outcomes.
Disclaimer
All information, articles, and product details provided on this website are for general informational and educational purposes only. We do not claim any ownership over, nor do we intend to infringe upon, any trademarks, copyrights, logos, brand names, or other intellectual property mentioned or depicted on this site. Such intellectual property remains the property of its respective owners, and any references here are made solely for identification or informational purposes, without implying any affiliation, endorsement, or partnership.
We make no representations or warranties, express or implied, regarding the accuracy, completeness, or suitability of any content or products presented. Nothing on this website should be construed as legal, tax, investment, financial, medical, or other professional advice. In addition, no part of this site—including articles or product references—constitutes a solicitation, recommendation, endorsement, advertisement, or offer to buy or sell any securities, franchises, or other financial instruments, particularly in jurisdictions where such activity would be unlawful.
All content is of a general nature and may not address the specific circumstances of any individual or entity. It is not a substitute for professional advice or services. Any actions you take based on the information provided here are strictly at your own risk. You accept full responsibility for any decisions or outcomes arising from your use of this website and agree to release us from any liability in connection with your use of, or reliance upon, the content or products found herein.