
|
Sichuan Swellfun Co., Ltd (600779.Ss) Avaliação DCF |
Totalmente Editável: Adapte-Se Às Suas Necessidades No Excel Ou Planilhas
Design Profissional: Modelos Confiáveis E Padrão Da Indústria
Pré-Construídos Para Uso Rápido E Eficiente
Compatível com MAC/PC, totalmente desbloqueado
Não É Necessária Experiência; Fácil De Seguir
Sichuan Swellfun Co.,Ltd (600779.SS) Bundle
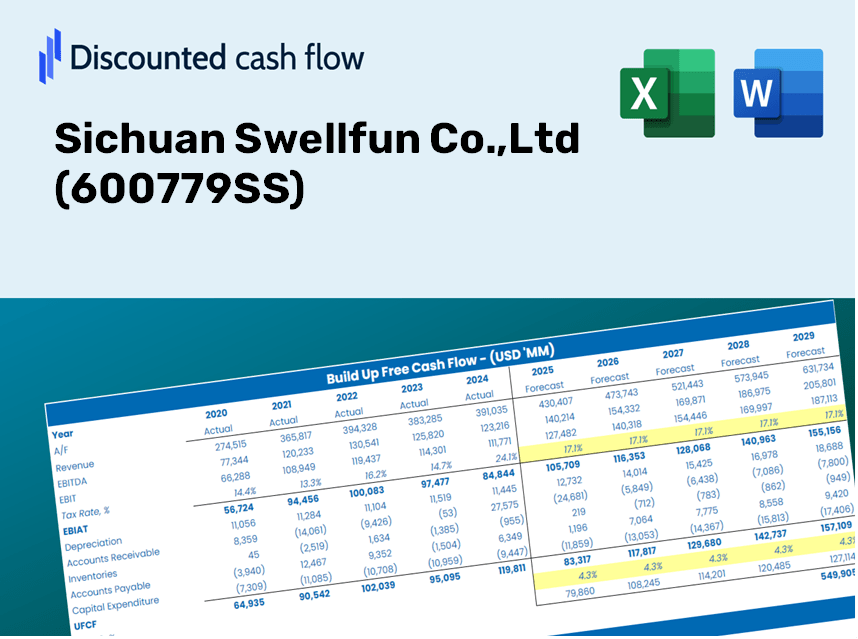
Descubra o verdadeiro potencial da Sichuan Swellfun Co., Ltd, com nossa calculadora DCF de nível profissional! Ajuste as principais suposições, explore vários cenários e avalie como as mudanças afetam a Sichuan Swellfun Co., a avaliação da LTD - tudo dentro de um único modelo do Excel.
Benefits You Will Receive
- Pre-Loaded Financial Model: Utilize Sichuan Swellfun's actual data for accurate DCF valuation.
- Comprehensive Forecast Control: Modify revenue growth, profit margins, WACC, and other essential parameters.
- Real-Time Calculations: Automatic updates allow you to see results instantly as you make adjustments.
- Professional-Quality Template: A polished Excel file crafted for top-tier valuation.
- Flexible and Reusable: Designed for adaptability, enabling repeated use for in-depth forecasts.
Key Features
- Customizable Forecast Inputs: Adjust essential parameters such as revenue growth, EBITDA %, and capital investments.
- Instant DCF Valuation: Quickly computes intrinsic value, NPV, and other financial metrics.
- High-Precision Accuracy: Leverages Sichuan Swellfun Co., Ltd's (600779SS) actual financial data for dependable valuation results.
- Simplified Scenario Analysis: Effortlessly test various assumptions and evaluate different outcomes.
- Efficiency Booster: Avoid the hassle of constructing intricate valuation models from the ground up.
How It Functions
- Step 1: Download the Excel spreadsheet.
- Step 2: Examine the pre-filled data for Sichuan Swellfun Co., Ltd (600779SS) (historical and projected).
- Step 3: Modify key assumptions (highlighted in yellow) based on your insights.
- Step 4: Observe the automatic updates for Sichuan Swellfun's intrinsic value.
- Step 5: Utilize the results for your investment strategies or reporting needs.
Why Choose This Calculator for Sichuan Swellfun Co., Ltd (600779SS)?
- All-in-One Tool: Combines DCF, WACC, and financial ratio analyses, tailored for Sichuan Swellfun Co., Ltd.
- Flexible Inputs: Modify the highlighted cells to explore different financial scenarios.
- In-Depth Analysis: Automatically computes the intrinsic value and Net Present Value for Sichuan Swellfun Co., Ltd.
- Preloaded Metrics: Access historical and forecasted data for reliable analysis.
- Designed for Professionals: Perfect for financial analysts, investors, and business consultants focused on Sichuan Swellfun Co., Ltd.
Who Should Use This Product?
- Individual Investors: Gain insights to make informed decisions when purchasing or selling Sichuan Swellfun Co., Ltd (600779SS) shares.
- Financial Analysts: Enhance valuation methodologies with comprehensive financial models designed for the beverage industry.
- Consultants: Provide clients with timely and precise valuation analyses related to Sichuan Swellfun Co., Ltd (600779SS).
- Business Owners: Analyze the valuation metrics of established companies like Sichuan Swellfun Co., Ltd (600779SS) to inform your own business strategies.
- Finance Students: Acquire practical knowledge of valuation practices using real data and case studies from Sichuan Swellfun Co., Ltd (600779SS).
Contents of the Template
- Pre-Filled DCF Model: Financial data for Sichuan Swellfun Co., Ltd (600779SS) preloaded for instant accessibility.
- WACC Calculator: Comprehensive calculations for the Weighted Average Cost of Capital.
- Financial Ratios: Analyze Sichuan Swellfun’s profitability, leverage, and operational efficiency.
- Editable Inputs: Modify assumptions like growth rates, profit margins, and CAPEX to suit your analysis.
- Financial Statements: Access annual and quarterly reports for thorough examination.
- Interactive Dashboard: Effortlessly visualize essential valuation metrics and outcomes.
Disclaimer
All information, articles, and product details provided on this website are for general informational and educational purposes only. We do not claim any ownership over, nor do we intend to infringe upon, any trademarks, copyrights, logos, brand names, or other intellectual property mentioned or depicted on this site. Such intellectual property remains the property of its respective owners, and any references here are made solely for identification or informational purposes, without implying any affiliation, endorsement, or partnership.
We make no representations or warranties, express or implied, regarding the accuracy, completeness, or suitability of any content or products presented. Nothing on this website should be construed as legal, tax, investment, financial, medical, or other professional advice. In addition, no part of this site—including articles or product references—constitutes a solicitation, recommendation, endorsement, advertisement, or offer to buy or sell any securities, franchises, or other financial instruments, particularly in jurisdictions where such activity would be unlawful.
All content is of a general nature and may not address the specific circumstances of any individual or entity. It is not a substitute for professional advice or services. Any actions you take based on the information provided here are strictly at your own risk. You accept full responsibility for any decisions or outcomes arising from your use of this website and agree to release us from any liability in connection with your use of, or reliance upon, the content or products found herein.