
|
CMST Development Co., Ltd. (600787.SS) Avaliação do DCF |
Totalmente Editável: Adapte-Se Às Suas Necessidades No Excel Ou Planilhas
Design Profissional: Modelos Confiáveis E Padrão Da Indústria
Pré-Construídos Para Uso Rápido E Eficiente
Compatível com MAC/PC, totalmente desbloqueado
Não É Necessária Experiência; Fácil De Seguir
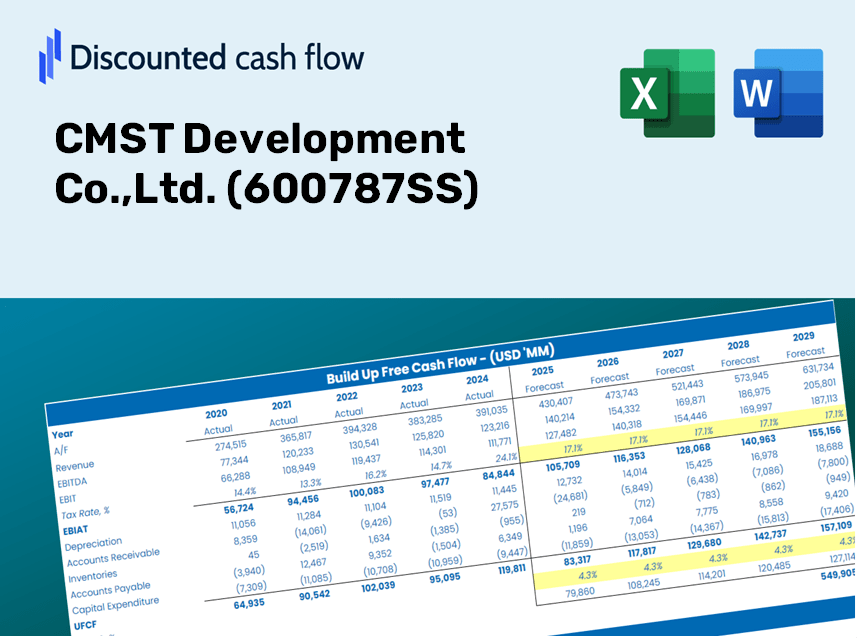
CMST Development Co.,Ltd. (600787.SS) Bundle
Otimize seu tempo e melhore a precisão com a calculadora DCF (600787SS)! Utilizando dados autênticos da CMST Development Co., Ltd. e suposições personalizáveis, essa ferramenta o capacita a prever, analisar e valorizar o CMST como um investidor experiente.
Discounted Cash Flow (DCF) - (USD MM)
| Year | AY1 2020 |
AY2 2021 |
AY3 2022 |
AY4 2023 |
AY5 2024 |
FY1 2025 |
FY2 2026 |
FY3 2027 |
FY4 2028 |
FY5 2029 |
|---|---|---|---|---|---|---|---|---|---|---|
| Revenue | 48,830.1 | 75,238.5 | 76,776.2 | 67,266.1 | 63,144.0 | 62,040.9 | 60,957.1 | 59,892.3 | 58,846.1 | 57,818.1 |
| Revenue Growth, % | 0 | 54.08 | 2.04 | -12.39 | -6.13 | -1.75 | -1.75 | -1.75 | -1.75 | -1.75 |
| EBITDA | 604.3 | 714.2 | 688.4 | 914.9 | 673.5 | 683.7 | 671.8 | 660.0 | 648.5 | 637.2 |
| EBITDA, % | 1.24 | 0.94922 | 0.8966 | 1.36 | 1.07 | 1.1 | 1.1 | 1.1 | 1.1 | 1.1 |
| Depreciation | 241.9 | 268.5 | 322.0 | 275.5 | 246.1 | 257.0 | 252.5 | 248.1 | 243.7 | 239.5 |
| Depreciation, % | 0.49546 | 0.35686 | 0.41945 | 0.40953 | 0.38968 | 0.41419 | 0.41419 | 0.41419 | 0.41419 | 0.41419 |
| EBIT | 362.4 | 445.7 | 366.3 | 639.4 | 427.5 | 426.7 | 419.3 | 412.0 | 404.8 | 397.7 |
| EBIT, % | 0.74216 | 0.59236 | 0.47715 | 0.95053 | 0.67696 | 0.68783 | 0.68783 | 0.68783 | 0.68783 | 0.68783 |
| Total Cash | 1,652.6 | 2,393.8 | 3,856.6 | 3,218.3 | 3,751.4 | 2,768.8 | 2,720.5 | 2,672.9 | 2,626.3 | 2,580.4 |
| Total Cash, percent | .0 | .0 | .0 | .0 | .0 | .0 | .0 | .0 | .0 | .0 |
| Account Receivables | 1,495.8 | 3,952.9 | 4,035.5 | 4,710.0 | 4,953.1 | 3,526.3 | 3,464.7 | 3,404.2 | 3,344.8 | 3,286.3 |
| Account Receivables, % | 3.06 | 5.25 | 5.26 | 7 | 7.84 | 5.68 | 5.68 | 5.68 | 5.68 | 5.68 |
| Inventories | 1,357.9 | 1,646.4 | 1,651.1 | 766.8 | 661.3 | 1,154.8 | 1,134.7 | 1,114.8 | 1,095.4 | 1,076.2 |
| Inventories, % | 2.78 | 2.19 | 2.15 | 1.14 | 1.05 | 1.86 | 1.86 | 1.86 | 1.86 | 1.86 |
| Accounts Payable | 1,835.1 | 2,003.7 | 1,738.3 | 1,345.9 | 1,379.3 | 1,597.0 | 1,569.1 | 1,541.7 | 1,514.8 | 1,488.3 |
| Accounts Payable, % | 3.76 | 2.66 | 2.26 | 2 | 2.18 | 2.57 | 2.57 | 2.57 | 2.57 | 2.57 |
| Capital Expenditure | -799.2 | -873.6 | -507.0 | -449.0 | -208.2 | -552.8 | -543.2 | -533.7 | -524.4 | -515.2 |
| Capital Expenditure, % | -1.64 | -1.16 | -0.66031 | -0.66752 | -0.3297 | -0.89107 | -0.89107 | -0.89107 | -0.89107 | -0.89107 |
| Tax Rate, % | 48.06 | 48.06 | 48.06 | 48.06 | 48.06 | 48.06 | 48.06 | 48.06 | 48.06 | 48.06 |
| EBITAT | 275.5 | 362.7 | 268.9 | 458.9 | 222.0 | 302.6 | 297.3 | 292.1 | 287.0 | 282.0 |
| Depreciation | ||||||||||
| Changes in Account Receivables | ||||||||||
| Changes in Inventories | ||||||||||
| Changes in Accounts Payable | ||||||||||
| Capital Expenditure | ||||||||||
| UFCF | -1,300.5 | -2,819.2 | -268.9 | 102.8 | 155.8 | 1,157.6 | 60.5 | 59.4 | 58.4 | 57.3 |
| WACC, % | 5.19 | 5.23 | 5.18 | 5.17 | 5.04 | 5.16 | 5.16 | 5.16 | 5.16 | 5.16 |
| PV UFCF | ||||||||||
| SUM PV UFCF | 1,298.8 | |||||||||
| Long Term Growth Rate, % | 3.50 | |||||||||
| Free cash flow (T + 1) | 59 | |||||||||
| Terminal Value | 3,570 | |||||||||
| Present Terminal Value | 2,776 | |||||||||
| Enterprise Value | 4,075 | |||||||||
| Net Debt | -2,052 | |||||||||
| Equity Value | 6,126 | |||||||||
| Diluted Shares Outstanding, MM | 2,121 | |||||||||
| Equity Value Per Share | 2.89 |
Benefits You Will Receive
- Customizable Excel Template: An easy-to-edit Excel-based DCF Calculator featuring pre-filled financial data for CMST Development Co., Ltd. (600787SS).
- Accurate Market Data: Access to historical figures and projected estimates (highlighted in the designated cells).
- Adjustable Forecasting: Modify key assumptions such as revenue growth, EBITDA margin, and WACC.
- Instant Calculations: Quickly observe how your adjustments affect the valuation of CMST Development Co., Ltd. (600787SS).
- Professional Resource: Designed for investors, CFOs, consultants, and financial analysts.
- Intuitive Layout: Created for simplicity and ease of navigation, complete with step-by-step guidance.
Key Features
- 🔍 Real-Life CMST Financials: Pre-filled historical and projected data for CMST Development Co., Ltd. (600787SS).
- ✏️ Fully Customizable Inputs: Adjust all critical parameters (yellow cells) such as WACC, growth %, and tax rates.
- 📊 Professional DCF Valuation: Integrated formulas to calculate the intrinsic value of CMST using the Discounted Cash Flow method.
- ⚡ Instant Results: Visualize CMST’s valuation in real-time after making adjustments.
- Scenario Analysis: Explore and compare outcomes for various financial assumptions side-by-side.
How It Functions
- Download: Obtain the ready-to-use Excel file containing CMST Development Co., Ltd.’s (600787SS) financial data.
- Customize: Modify forecasts such as revenue growth, EBITDA percentage, and WACC.
- Update Automatically: The intrinsic value and NPV calculations refresh in real-time.
- Test Scenarios: Generate various projections and instantly compare results.
- Make Decisions: Utilize the valuation outcomes to inform your investment strategy.
Why Choose CMST Development Co., Ltd. (600787SS)?
- Precision: Utilizes genuine CMST financial data to ensure precise calculations.
- Adaptability: Engineered to allow users to easily adjust and test various inputs.
- Efficiency: Eliminate the complexities of creating a financial model from the ground up.
- Expert-Level: Crafted with the accuracy and functionality expected by industry professionals.
- Intuitive: Simple to navigate, even for those without extensive financial modeling skills.
Who Can Benefit from CMST Development Co.,Ltd. (600787SS)?
- Finance Students: Master valuation methods and practice with actual data.
- Researchers: Integrate industry-standard models into academic projects or studies.
- Investors: Validate your investment hypotheses and evaluate performance metrics for CMST Development Co.,Ltd. (600787SS).
- Financial Analysts: Enhance your efficiency with a ready-to-use, adaptable DCF model.
- Entrepreneurs: Understand how major companies like CMST Development Co.,Ltd. (600787SS) are assessed in the market.
Contents of the Template
- Pre-Filled Data: Features CMST Development Co., Ltd.'s historical financial figures and projections.
- Discounted Cash Flow Model: An editable DCF valuation model equipped with automatic calculations.
- Weighted Average Cost of Capital (WACC): A specific sheet designed for calculating WACC based on user-defined inputs.
- Key Financial Ratios: Examine CMST Development Co., Ltd.'s profitability, efficiency, and financial leverage.
- Customizable Inputs: Easily adjust revenue growth, profit margins, and tax rates.
- Intuitive Dashboard: Visual representations and tables highlighting essential valuation outcomes.
Disclaimer
All information, articles, and product details provided on this website are for general informational and educational purposes only. We do not claim any ownership over, nor do we intend to infringe upon, any trademarks, copyrights, logos, brand names, or other intellectual property mentioned or depicted on this site. Such intellectual property remains the property of its respective owners, and any references here are made solely for identification or informational purposes, without implying any affiliation, endorsement, or partnership.
We make no representations or warranties, express or implied, regarding the accuracy, completeness, or suitability of any content or products presented. Nothing on this website should be construed as legal, tax, investment, financial, medical, or other professional advice. In addition, no part of this site—including articles or product references—constitutes a solicitation, recommendation, endorsement, advertisement, or offer to buy or sell any securities, franchises, or other financial instruments, particularly in jurisdictions where such activity would be unlawful.
All content is of a general nature and may not address the specific circumstances of any individual or entity. It is not a substitute for professional advice or services. Any actions you take based on the information provided here are strictly at your own risk. You accept full responsibility for any decisions or outcomes arising from your use of this website and agree to release us from any liability in connection with your use of, or reliance upon, the content or products found herein.