
|
Shandong Lukang Pharmaceutical Co., Ltd. (600789.Ss) Avaliação do DCF |
Totalmente Editável: Adapte-Se Às Suas Necessidades No Excel Ou Planilhas
Design Profissional: Modelos Confiáveis E Padrão Da Indústria
Pré-Construídos Para Uso Rápido E Eficiente
Compatível com MAC/PC, totalmente desbloqueado
Não É Necessária Experiência; Fácil De Seguir
Shandong Lukang Pharmaceutical Co.,Ltd. (600789.SS) Bundle
Simplifique Shandong Lukang Pharmaceutical Co., Ltd. Avaliação com esta calculadora DCF personalizável! Apresentando a verdadeira Shandong Lukang Pharmaceutical Co., Ltd. Financeiros e insumos de previsão ajustáveis, você pode testar cenários e descobrir Shandong Lukang Pharmaceutical Co., Ltd. valor justo em minutos.
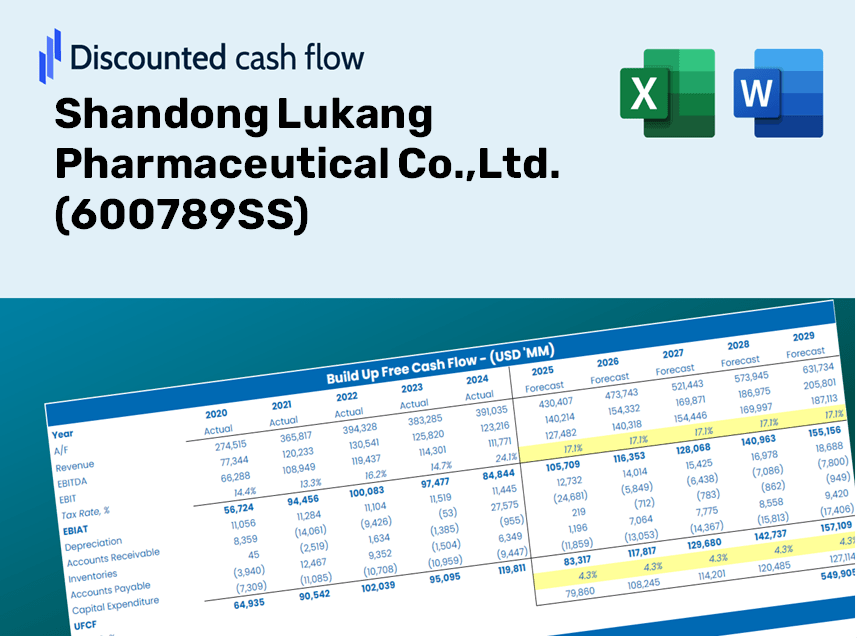
Discounted Cash Flow (DCF) - (USD MM)
| Year | AY1 2020 |
AY2 2021 |
AY3 2022 |
AY4 2023 |
AY5 2024 |
FY1 2025 |
FY2 2026 |
FY3 2027 |
FY4 2028 |
FY5 2029 |
|---|---|---|---|---|---|---|---|---|---|---|
| Revenue | 4,205.1 | 4,923.8 | 5,621.4 | 6,146.7 | 6,233.1 | 6,887.7 | 7,611.1 | 8,410.4 | 9,293.7 | 10,269.7 |
| Revenue Growth, % | 0 | 17.09 | 14.17 | 9.34 | 1.41 | 10.5 | 10.5 | 10.5 | 10.5 | 10.5 |
| EBITDA | 354.9 | 450.8 | 542.2 | 647.3 | 715.7 | 678.5 | 749.8 | 828.5 | 915.5 | 1,011.7 |
| EBITDA, % | 8.44 | 9.16 | 9.64 | 10.53 | 11.48 | 9.85 | 9.85 | 9.85 | 9.85 | 9.85 |
| Depreciation | 243.9 | 307.5 | 348.1 | 381.1 | 399.0 | 424.8 | 469.5 | 518.8 | 573.2 | 633.4 |
| Depreciation, % | 5.8 | 6.24 | 6.19 | 6.2 | 6.4 | 6.17 | 6.17 | 6.17 | 6.17 | 6.17 |
| EBIT | 111.0 | 143.4 | 194.1 | 266.1 | 316.7 | 253.7 | 280.3 | 309.8 | 342.3 | 378.2 |
| EBIT, % | 2.64 | 2.91 | 3.45 | 4.33 | 5.08 | 3.68 | 3.68 | 3.68 | 3.68 | 3.68 |
| Total Cash | 648.8 | 555.2 | 690.1 | 799.7 | 773.8 | 887.2 | 980.4 | 1,083.3 | 1,197.1 | 1,322.8 |
| Total Cash, percent | .0 | .0 | .0 | .0 | .0 | .0 | .0 | .0 | .0 | .0 |
| Account Receivables | 858.3 | 824.4 | 1,232.2 | 1,346.1 | 1,791.8 | 1,511.4 | 1,670.2 | 1,845.6 | 2,039.4 | 2,253.6 |
| Account Receivables, % | 20.41 | 16.74 | 21.92 | 21.9 | 28.75 | 21.94 | 21.94 | 21.94 | 21.94 | 21.94 |
| Inventories | 869.1 | 1,205.6 | 1,480.7 | 1,406.0 | 1,484.2 | 1,627.9 | 1,798.9 | 1,987.8 | 2,196.6 | 2,427.3 |
| Inventories, % | 20.67 | 24.48 | 26.34 | 22.87 | 23.81 | 23.64 | 23.64 | 23.64 | 23.64 | 23.64 |
| Accounts Payable | 1,154.3 | 1,164.5 | 1,611.0 | 1,502.6 | 1,502.7 | 1,767.6 | 1,953.2 | 2,158.3 | 2,385.0 | 2,635.5 |
| Accounts Payable, % | 27.45 | 23.65 | 28.66 | 24.45 | 24.11 | 25.66 | 25.66 | 25.66 | 25.66 | 25.66 |
| Capital Expenditure | -703.1 | -486.7 | -428.4 | -337.9 | -279.2 | -608.9 | -672.9 | -743.5 | -821.6 | -907.9 |
| Capital Expenditure, % | -16.72 | -9.89 | -7.62 | -5.5 | -4.48 | -8.84 | -8.84 | -8.84 | -8.84 | -8.84 |
| Tax Rate, % | 9.05 | 9.05 | 9.05 | 9.05 | 9.05 | 9.05 | 9.05 | 9.05 | 9.05 | 9.05 |
| EBITAT | 96.5 | 112.5 | 178.4 | 240.0 | 288.1 | 222.4 | 245.8 | 271.6 | 300.1 | 331.7 |
| Depreciation | ||||||||||
| Changes in Account Receivables | ||||||||||
| Changes in Inventories | ||||||||||
| Changes in Accounts Payable | ||||||||||
| Capital Expenditure | ||||||||||
| UFCF | -935.8 | -359.2 | -138.2 | 135.7 | -116.0 | 439.9 | -101.7 | -112.3 | -124.1 | -137.2 |
| WACC, % | 4.22 | 4.15 | 4.26 | 4.25 | 4.25 | 4.23 | 4.23 | 4.23 | 4.23 | 4.23 |
| PV UFCF | ||||||||||
| SUM PV UFCF | 12.5 | |||||||||
| Long Term Growth Rate, % | 3.00 | |||||||||
| Free cash flow (T + 1) | -141 | |||||||||
| Terminal Value | -11,523 | |||||||||
| Present Terminal Value | -9,369 | |||||||||
| Enterprise Value | -9,357 | |||||||||
| Net Debt | 1,785 | |||||||||
| Equity Value | -11,142 | |||||||||
| Diluted Shares Outstanding, MM | 897 | |||||||||
| Equity Value Per Share | -12.42 |
What You Will Receive
- Genuine Shandong Lukang Data: Comprehensive financial insights – from revenue to EBIT – utilizing both actual and projected figures.
- Complete Customization: Modify all essential parameters (highlighted cells) such as WACC, growth %, and tax rates.
- Immediate Valuation Adjustments: Automatic recalculations to assess the effects of changes on Shandong Lukang's fair value.
- Flexible Excel Template: Designed for quick modifications, scenario analysis, and extensive projections.
- Efficient and Precise: Avoid constructing models from the ground up while ensuring accuracy and adaptability.
Core Highlights
- Customizable Forecast Inputs: Adjust essential variables such as revenue growth, EBITDA percentage, and capital expenditures.
- Instant DCF Valuation: Quickly computes intrinsic value, NPV, and additional financial metrics.
- Precision at a Professional Level: Utilizes Shandong Lukang Pharmaceutical's real financial data for accurate valuation results.
- Simplified Scenario Analysis: Effortlessly examine various assumptions and analyze the resulting outcomes.
- Efficient Valuation Tool: Removes the necessity of creating complex valuation models from the ground up.
How It Works
- Step 1: Download the Excel file for Shandong Lukang Pharmaceutical Co.,Ltd. (600789SS).
- Step 2: Review the pre-filled financial data and forecasts for Shandong Lukang.
- Step 3: Modify key inputs such as revenue growth, WACC, and tax rates (highlighted cells).
- Step 4: Observe how the DCF model updates in real-time as you adjust your assumptions.
- Step 5: Assess the outputs and leverage the results for your investment strategies.
Why Opt for Shandong Lukang Pharmaceutical Co., Ltd. Calculator?
- Reliable Data: Accurate financials for Shandong Lukang ensure trustworthy valuation outcomes.
- Tailorable: Modify essential parameters such as growth projections, WACC, and tax rates to align with your estimates.
- Efficient: Pre-configured calculations save you time and effort in the analysis process.
- Professional Tool: Crafted for use by investors, analysts, and consultants in the pharmaceutical sector.
- Easy to Use: A user-friendly interface paired with clear instructions simplifies the process for everyone.
Who Can Benefit from This Product?
- Pharmacy Students: Master pharmaceutical valuation techniques and apply them using real-world data.
- Researchers: Integrate professional valuation models into your academic projects or studies.
- Investors: Validate your investment strategies and assess valuation results for Shandong Lukang Pharmaceutical Co.,Ltd. (600789SS).
- Market Analysts: Enhance your analysis process with a customizable and ready-to-use DCF model.
- Healthcare Entrepreneurs: Understand how large pharmaceutical companies like Shandong Lukang are evaluated.
Contents of the Template
- Preloaded 600789SS Data: Historical and forecasted financial information, encompassing revenue, EBIT, and capital expenditures.
- DCF and WACC Models: Advanced worksheets designed for calculating intrinsic value and Weighted Average Cost of Capital.
- Editable Inputs: Cells highlighted in yellow for modifying revenue growth, tax rates, and discount rates.
- Financial Statements: Detailed annual and quarterly financial reports for in-depth analysis.
- Key Ratios: Metrics for profitability, leverage, and efficiency to assess performance.
- Dashboard and Charts: Visual representations of valuation results and underlying assumptions.
Disclaimer
All information, articles, and product details provided on this website are for general informational and educational purposes only. We do not claim any ownership over, nor do we intend to infringe upon, any trademarks, copyrights, logos, brand names, or other intellectual property mentioned or depicted on this site. Such intellectual property remains the property of its respective owners, and any references here are made solely for identification or informational purposes, without implying any affiliation, endorsement, or partnership.
We make no representations or warranties, express or implied, regarding the accuracy, completeness, or suitability of any content or products presented. Nothing on this website should be construed as legal, tax, investment, financial, medical, or other professional advice. In addition, no part of this site—including articles or product references—constitutes a solicitation, recommendation, endorsement, advertisement, or offer to buy or sell any securities, franchises, or other financial instruments, particularly in jurisdictions where such activity would be unlawful.
All content is of a general nature and may not address the specific circumstances of any individual or entity. It is not a substitute for professional advice or services. Any actions you take based on the information provided here are strictly at your own risk. You accept full responsibility for any decisions or outcomes arising from your use of this website and agree to release us from any liability in connection with your use of, or reliance upon, the content or products found herein.