
|
Zhejiang China Light & Têxtil Industrial City Group Co., Ltd (600790.SS) Avaliação DCF |
Totalmente Editável: Adapte-Se Às Suas Necessidades No Excel Ou Planilhas
Design Profissional: Modelos Confiáveis E Padrão Da Indústria
Pré-Construídos Para Uso Rápido E Eficiente
Compatível com MAC/PC, totalmente desbloqueado
Não É Necessária Experiência; Fácil De Seguir
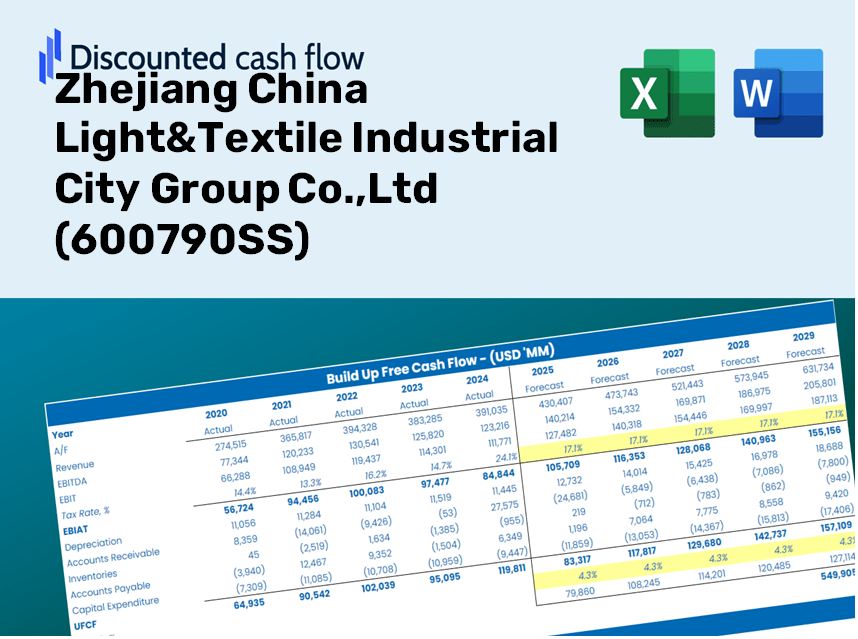
Zhejiang China Light&Textile Industrial City Group Co.,Ltd (600790.SS) Bundle
Avalie a perspectiva financeira da luz da China Zhejiang & TEXTILE Industrial City Group Co., Ltd como um especialista! Esta calculadora DCF (600790SS) fornece dados financeiros pré-preenchidos e flexibilidade total para modificar o crescimento da receita, o WACC, as margens e outras suposições cruciais para se alinhar com suas previsões.
Discounted Cash Flow (DCF) - (USD MM)
| Year | AY1 2020 |
AY2 2021 |
AY3 2022 |
AY4 2023 |
AY5 2024 |
FY1 2025 |
FY2 2026 |
FY3 2027 |
FY4 2028 |
FY5 2029 |
|---|---|---|---|---|---|---|---|---|---|---|
| Revenue | 819.7 | 927.2 | 820.2 | 854.8 | 949.6 | 989.8 | 1,031.6 | 1,075.1 | 1,120.6 | 1,167.9 |
| Revenue Growth, % | 0 | 13.13 | -11.55 | 4.22 | 11.1 | 4.22 | 4.22 | 4.22 | 4.22 | 4.22 |
| EBITDA | 480.9 | 698.7 | 1,783.6 | 540.7 | 483.7 | 689.3 | 718.4 | 748.7 | 780.4 | 813.3 |
| EBITDA, % | 58.66 | 75.35 | 217.46 | 63.25 | 50.94 | 69.64 | 69.64 | 69.64 | 69.64 | 69.64 |
| Depreciation | 239.5 | 239.5 | 220.8 | 214.5 | 242.7 | 262.5 | 273.6 | 285.2 | 297.2 | 309.8 |
| Depreciation, % | 29.23 | 25.82 | 26.92 | 25.1 | 25.56 | 26.53 | 26.53 | 26.53 | 26.53 | 26.53 |
| EBIT | 241.3 | 459.3 | 1,562.8 | 326.1 | 241.0 | 480.0 | 500.3 | 521.5 | 543.5 | 566.4 |
| EBIT, % | 29.44 | 49.53 | 190.54 | 38.15 | 25.38 | 48.5 | 48.5 | 48.5 | 48.5 | 48.5 |
| Total Cash | 802.7 | 1,479.1 | 1,758.4 | 2,593.9 | 1,520.6 | 985.7 | 1,027.3 | 1,070.7 | 1,115.9 | 1,163.0 |
| Total Cash, percent | .0 | .0 | .0 | .0 | .0 | .0 | .0 | .0 | .0 | .0 |
| Account Receivables | 31.3 | 36.3 | 589.4 | 390.3 | 426.6 | 336.9 | 351.1 | 365.9 | 381.4 | 397.5 |
| Account Receivables, % | 3.82 | 3.91 | 71.86 | 45.66 | 44.92 | 34.03 | 34.03 | 34.03 | 34.03 | 34.03 |
| Inventories | .4 | 189.2 | .0 | .0 | 3.1 | 41.1 | 42.8 | 44.7 | 46.5 | 48.5 |
| Inventories, % | 0.0438691 | 20.4 | 0 | 0 | 0.32328 | 4.15 | 4.15 | 4.15 | 4.15 | 4.15 |
| Accounts Payable | 62.8 | 35.4 | 52.5 | 133.9 | 624.4 | 196.5 | 204.9 | 213.5 | 222.5 | 231.9 |
| Accounts Payable, % | 7.66 | 3.82 | 6.4 | 15.67 | 65.75 | 19.86 | 19.86 | 19.86 | 19.86 | 19.86 |
| Capital Expenditure | -58.0 | -108.5 | -1,088.6 | -1,252.6 | -972.4 | -631.0 | -657.7 | -685.5 | -714.4 | -744.6 |
| Capital Expenditure, % | -7.08 | -11.7 | -132.73 | -146.53 | -102.4 | -63.76 | -63.76 | -63.76 | -63.76 | -63.76 |
| Tax Rate, % | 21 | 21 | 21 | 21 | 21 | 21 | 21 | 21 | 21 | 21 |
| EBITAT | 192.2 | 383.1 | 1,173.1 | 249.6 | 190.4 | 377.9 | 393.9 | 410.6 | 427.9 | 446.0 |
| Depreciation | ||||||||||
| Changes in Account Receivables | ||||||||||
| Changes in Inventories | ||||||||||
| Changes in Accounts Payable | ||||||||||
| Capital Expenditure | ||||||||||
| UFCF | 404.9 | 292.8 | -41.6 | -507.9 | -88.2 | -366.7 | 2.2 | 2.3 | 2.4 | 2.5 |
| WACC, % | 4.43 | 4.47 | 4.38 | 4.4 | 4.42 | 4.42 | 4.42 | 4.42 | 4.42 | 4.42 |
| PV UFCF | ||||||||||
| SUM PV UFCF | -343.2 | |||||||||
| Long Term Growth Rate, % | 0.50 | |||||||||
| Free cash flow (T + 1) | 2 | |||||||||
| Terminal Value | 63 | |||||||||
| Present Terminal Value | 51 | |||||||||
| Enterprise Value | -292 | |||||||||
| Net Debt | 748 | |||||||||
| Equity Value | -1,040 | |||||||||
| Diluted Shares Outstanding, MM | 1,408 | |||||||||
| Equity Value Per Share | -0.74 |
Benefits You Will Receive
- Authentic Financial Data: Comprehensive financial metrics – from revenue to EBIT – derived from actual and forecasted data for Zhejiang China Light & Textile Industrial City Group Co., Ltd (600790SS).
- Complete Customization: Modify all key inputs (highlighted cells) such as WACC, growth percentage, and tax rates to fit your analysis.
- Immediate Valuation Adjustments: Automatic recalibrations to evaluate the effects of changes on the fair value of Zhejiang China Light & Textile Industrial City Group Co., Ltd (600790SS).
- Flexible Excel Template: Designed for quick modifications, scenario analysis, and in-depth forecasting.
- Efficient and Precise: Bypass the need to create models from the ground up while ensuring accuracy and adaptability.
Key Features
- 🔍 Real-Life ZJLT Financials: Pre-filled historical and projected data for Zhejiang China Light & Textile Industrial City Group Co., Ltd (600790SS).
- ✏️ Fully Customizable Inputs: Adjust all critical parameters (yellow cells) such as WACC, growth %, and tax rates.
- 📊 Professional DCF Valuation: Built-in formulas compute ZJLT's intrinsic value using the Discounted Cash Flow method.
- ⚡ Instant Results: Visualize ZJLT’s valuation immediately after modifications are applied.
- Scenario Analysis: Test and compare outcomes for various financial assumptions side-by-side.
How It Operates
- Step 1: Download the preformatted Excel template featuring data for Zhejiang China Light & Textile Industrial City Group Co., Ltd (600790SS).
- Step 2: Navigate through the populated sheets to familiarize yourself with the essential metrics.
- Step 3: Adjust forecasts and assumptions in the editable yellow cells (WACC, growth, margins).
- Step 4: Instantly view updated results, including the intrinsic value of Zhejiang China Light & Textile Industrial City Group Co., Ltd (600790SS).
- Step 5: Utilize the outputs to make informed investment choices or create detailed reports.
Why Choose the [Symbol] Calculator?
- Time Efficient: Skip the hassle of building a DCF model from the ground up – it's readily available for use.
- Enhanced Accuracy: Dependable financial data and formulas minimize valuation errors.
- Completely Customizable: Adjust the model to align with your assumptions and forecasts.
- User-Friendly: Intuitive charts and outputs simplify the analysis of results.
- Endorsed by Professionals: Crafted for experts who prioritize accuracy and functionality.
Who Can Benefit from Our Services?
- Investors: Make informed investment choices using our advanced valuation tools.
- Financial Analysts: Streamline your workflow with our customizable DCF model.
- Consultants: Effortlessly modify our templates for client deliverables and presentations.
- Finance Enthusiasts: Enhance your grasp of valuation methods with practical, real-world applications.
- Educators and Students: Leverage our resources as a hands-on learning aid in finance studies.
What the Template Contains
- Pre-Filled DCF Model: Zhejiang China Light & Textile Industrial City Group Co., Ltd’s financial data loaded for instant access.
- WACC Calculator: Comprehensive calculations for the Weighted Average Cost of Capital.
- Financial Ratios: Assess the company’s profitability, leverage, and efficiency.
- Editable Inputs: Modify assumptions like growth rates, margins, and CAPEX to suit your analysis.
- Financial Statements: Access to annual and quarterly reports for thorough examination.
- Interactive Dashboard: Effortlessly visualize essential valuation metrics and outcomes.
Disclaimer
All information, articles, and product details provided on this website are for general informational and educational purposes only. We do not claim any ownership over, nor do we intend to infringe upon, any trademarks, copyrights, logos, brand names, or other intellectual property mentioned or depicted on this site. Such intellectual property remains the property of its respective owners, and any references here are made solely for identification or informational purposes, without implying any affiliation, endorsement, or partnership.
We make no representations or warranties, express or implied, regarding the accuracy, completeness, or suitability of any content or products presented. Nothing on this website should be construed as legal, tax, investment, financial, medical, or other professional advice. In addition, no part of this site—including articles or product references—constitutes a solicitation, recommendation, endorsement, advertisement, or offer to buy or sell any securities, franchises, or other financial instruments, particularly in jurisdictions where such activity would be unlawful.
All content is of a general nature and may not address the specific circumstances of any individual or entity. It is not a substitute for professional advice or services. Any actions you take based on the information provided here are strictly at your own risk. You accept full responsibility for any decisions or outcomes arising from your use of this website and agree to release us from any liability in connection with your use of, or reliance upon, the content or products found herein.