
|
Zhengzhou Deheng Hongsheng Technology Co., Ltd. (600817.ss) DCF Avaliação |
Totalmente Editável: Adapte-Se Às Suas Necessidades No Excel Ou Planilhas
Design Profissional: Modelos Confiáveis E Padrão Da Indústria
Pré-Construídos Para Uso Rápido E Eficiente
Compatível com MAC/PC, totalmente desbloqueado
Não É Necessária Experiência; Fácil De Seguir
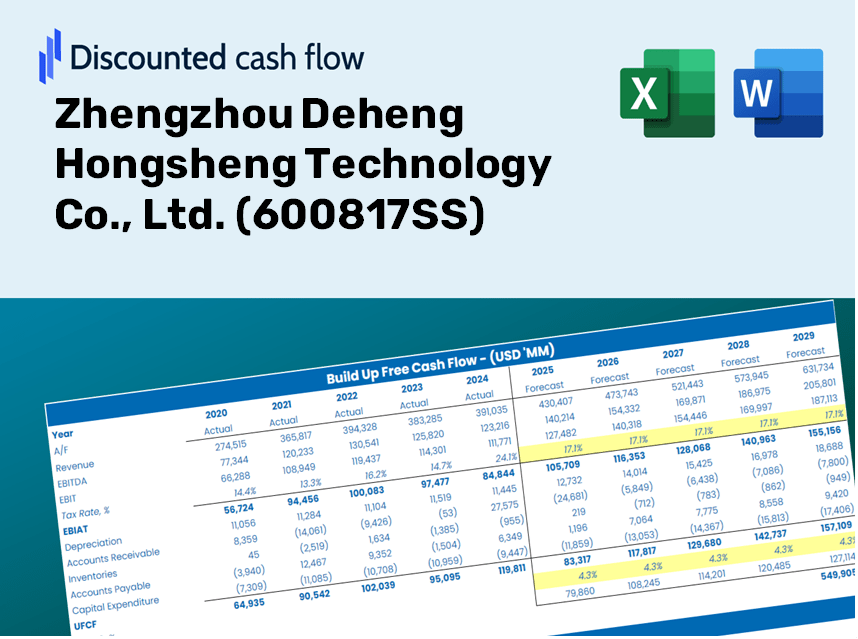
Zhengzhou Deheng Hongsheng Technology Co., Ltd. (600817.SS) Bundle
Atualize sua análise e melhore a precisão com a calculadora DCF (600817SS)! Equipado com dados reais da Zhengzhou Deheng Hongsheng Technology Co., Ltd. e suposições personalizáveis, essa ferramenta capacita você a prever, analisar e valorizar (600817Ss) como um investidor experiente.
Discounted Cash Flow (DCF) - (USD MM)
| Year | AY1 2020 |
AY2 2021 |
AY3 2022 |
AY4 2023 |
AY5 2024 |
FY1 2025 |
FY2 2026 |
FY3 2027 |
FY4 2028 |
FY5 2029 |
|---|---|---|---|---|---|---|---|---|---|---|
| Revenue | 3,484.2 | 3,756.5 | 3,585.3 | 2,907.0 | 3,798.6 | 3,941.1 | 4,089.0 | 4,242.4 | 4,401.6 | 4,566.7 |
| Revenue Growth, % | 0 | 7.82 | -4.56 | -18.92 | 30.67 | 3.75 | 3.75 | 3.75 | 3.75 | 3.75 |
| EBITDA | 503.3 | 596.9 | 594.4 | 346.7 | 373.3 | 541.2 | 561.5 | 582.6 | 604.5 | 627.2 |
| EBITDA, % | 14.44 | 15.89 | 16.58 | 11.93 | 9.83 | 13.73 | 13.73 | 13.73 | 13.73 | 13.73 |
| Depreciation | 95.9 | 108.6 | 101.2 | 90.6 | 70.5 | 105.9 | 109.9 | 114.0 | 118.2 | 122.7 |
| Depreciation, % | 2.75 | 2.89 | 2.82 | 3.12 | 1.85 | 2.69 | 2.69 | 2.69 | 2.69 | 2.69 |
| EBIT | 407.4 | 488.3 | 493.2 | 256.1 | 302.9 | 435.4 | 451.7 | 468.6 | 486.2 | 504.5 |
| EBIT, % | 11.69 | 13 | 13.76 | 8.81 | 7.97 | 11.05 | 11.05 | 11.05 | 11.05 | 11.05 |
| Total Cash | 1,896.1 | 1,910.2 | 1,363.3 | 1,146.5 | 1,447.8 | 1,740.8 | 1,806.1 | 1,873.9 | 1,944.2 | 2,017.1 |
| Total Cash, percent | .0 | .0 | .0 | .0 | .0 | .0 | .0 | .0 | .0 | .0 |
| Account Receivables | 731.6 | 991.0 | 1,544.7 | 1,611.4 | 1,554.0 | 1,472.5 | 1,527.7 | 1,585.0 | 1,644.5 | 1,706.2 |
| Account Receivables, % | 21 | 26.38 | 43.09 | 55.43 | 40.91 | 37.36 | 37.36 | 37.36 | 37.36 | 37.36 |
| Inventories | 293.1 | 429.4 | 328.5 | 378.9 | 284.2 | 390.4 | 405.0 | 420.2 | 436.0 | 452.3 |
| Inventories, % | 8.41 | 11.43 | 9.16 | 13.03 | 7.48 | 9.9 | 9.9 | 9.9 | 9.9 | 9.9 |
| Accounts Payable | 991.4 | 1,220.4 | 1,090.0 | 834.9 | 875.8 | 1,128.1 | 1,170.4 | 1,214.4 | 1,259.9 | 1,307.2 |
| Accounts Payable, % | 28.45 | 32.49 | 30.4 | 28.72 | 23.06 | 28.62 | 28.62 | 28.62 | 28.62 | 28.62 |
| Capital Expenditure | -36.2 | -41.6 | -52.7 | -21.3 | -20.4 | -38.5 | -39.9 | -41.4 | -43.0 | -44.6 |
| Capital Expenditure, % | -1.04 | -1.11 | -1.47 | -0.73347 | -0.53623 | -0.97697 | -0.97697 | -0.97697 | -0.97697 | -0.97697 |
| Tax Rate, % | 24.09 | 24.09 | 24.09 | 24.09 | 24.09 | 24.09 | 24.09 | 24.09 | 24.09 | 24.09 |
| EBITAT | 303.7 | 395.1 | 385.3 | 218.2 | 229.9 | 343.7 | 356.6 | 369.9 | 383.8 | 398.2 |
| Depreciation | ||||||||||
| Changes in Account Receivables | ||||||||||
| Changes in Inventories | ||||||||||
| Changes in Accounts Payable | ||||||||||
| Capital Expenditure | ||||||||||
| UFCF | 330.0 | 295.4 | -149.5 | -84.7 | 473.0 | 638.7 | 398.9 | 413.9 | 429.4 | 445.5 |
| WACC, % | 6.43 | 6.44 | 6.44 | 6.45 | 6.44 | 6.44 | 6.44 | 6.44 | 6.44 | 6.44 |
| PV UFCF | ||||||||||
| SUM PV UFCF | 1,955.9 | |||||||||
| Long Term Growth Rate, % | 2.00 | |||||||||
| Free cash flow (T + 1) | 454 | |||||||||
| Terminal Value | 10,233 | |||||||||
| Present Terminal Value | 7,490 | |||||||||
| Enterprise Value | 9,446 | |||||||||
| Net Debt | -1,347 | |||||||||
| Equity Value | 10,793 | |||||||||
| Diluted Shares Outstanding, MM | 528 | |||||||||
| Equity Value Per Share | 20.44 |
What's Included
- Comprehensive Financial Model: Utilize Zhengzhou Deheng Hongsheng Technology Co., Ltd.'s (600817SS) actual performance data for accurate DCF valuation.
- Complete Forecast Management: Modify revenue growth, profit margins, WACC, and other critical factors effortlessly.
- Real-Time Calculations: Instantaneous updates display results as you make adjustments.
- Professional-Grade Template: A polished Excel framework crafted for high-quality valuation presentations.
- Flexible and Reusable: Designed for adaptability, enabling ongoing use for in-depth financial forecasting.
Key Features
- Customizable Financial Assumptions: Adjust essential metrics such as revenue growth, EBITDA percentage, and capital expenditures.
- Instant DCF Valuation: Quickly computes intrinsic value, NPV, and other financial metrics.
- High-Precision Accuracy: Leverages Zhengzhou Deheng Hongsheng Technology Co., Ltd.'s real financial data for credible valuation results.
- Effortless Scenario Analysis: Easily evaluate various assumptions and analyze their impact on outcomes.
- Efficiency Booster: Remove the hassle of constructing intricate valuation models from the ground up.
How It Functions
- Obtain the Template: Gain immediate access to the Excel-based ZDH DCF Calculator.
- Enter Your Assumptions: Modify the yellow-highlighted cells for growth rates, WACC, profit margins, and additional parameters.
- Automatic Calculations: The model instantly recalculates the intrinsic value of Zhengzhou Deheng Hongsheng Technology Co., Ltd. (600817SS).
- Explore Scenarios: Test various assumptions to analyze potential shifts in valuation.
- Evaluate and Decide: Leverage the findings to inform your investment or financial assessment.
Why Opt for Our Calculator?
- Precision: Leveraging accurate financial data from Zhengzhou Deheng Hongsheng Technology Co., Ltd. ensures reliable results.
- Versatility: Tailored for users to freely explore and adjust various inputs.
- Efficiency: Avoid the complexities of creating a DCF model from the ground up.
- Expert-Level: Crafted with the expertise and usability considerations of CFOs.
- Intuitive: Simple to navigate, making it accessible for those without extensive financial modeling skills.
Who Can Benefit from Our Services?
- Investors: Make informed investment choices with our advanced technology solutions.
- Financial Analysts: Streamline your analysis process with our customizable tools tailored for efficiency.
- Consultants: Effortlessly modify our resources for impactful client presentations or reports.
- Finance Enthusiasts: Enhance your knowledge of financial technologies through practical applications and case studies.
- Educators and Students: Integrate our tools into finance curricula for hands-on learning experiences.
What the Template Includes
- Preloaded ZDH Data: Historical and forecasted financial metrics, such as revenue, EBIT, and capital expenditures.
- DCF and WACC Models: Professional-quality spreadsheets designed for calculating intrinsic value and Weighted Average Cost of Capital.
- Editable Inputs: Yellow-highlighted fields for modifying revenue growth, tax rates, and discount rates.
- Financial Statements: Detailed annual and quarterly financial reports for thorough analysis.
- Key Ratios: Metrics for profitability, leverage, and efficiency to assess performance.
- Dashboard and Charts: Visual representations of valuation results and underlying assumptions.
Disclaimer
All information, articles, and product details provided on this website are for general informational and educational purposes only. We do not claim any ownership over, nor do we intend to infringe upon, any trademarks, copyrights, logos, brand names, or other intellectual property mentioned or depicted on this site. Such intellectual property remains the property of its respective owners, and any references here are made solely for identification or informational purposes, without implying any affiliation, endorsement, or partnership.
We make no representations or warranties, express or implied, regarding the accuracy, completeness, or suitability of any content or products presented. Nothing on this website should be construed as legal, tax, investment, financial, medical, or other professional advice. In addition, no part of this site—including articles or product references—constitutes a solicitation, recommendation, endorsement, advertisement, or offer to buy or sell any securities, franchises, or other financial instruments, particularly in jurisdictions where such activity would be unlawful.
All content is of a general nature and may not address the specific circumstances of any individual or entity. It is not a substitute for professional advice or services. Any actions you take based on the information provided here are strictly at your own risk. You accept full responsibility for any decisions or outcomes arising from your use of this website and agree to release us from any liability in connection with your use of, or reliance upon, the content or products found herein.