
|
Sichuan Changhong Electric Co., Ltd. (600839.Ss) Avaliação do DCF |
Totalmente Editável: Adapte-Se Às Suas Necessidades No Excel Ou Planilhas
Design Profissional: Modelos Confiáveis E Padrão Da Indústria
Pré-Construídos Para Uso Rápido E Eficiente
Compatível com MAC/PC, totalmente desbloqueado
Não É Necessária Experiência; Fácil De Seguir
Sichuan Changhong Electric Co.,Ltd. (600839.SS) Bundle
Explore as perspectivas financeiras da Sichuan Changong Electric Co., Ltd. (600839Ss) usando nossa calculadora DCF amigável! Digite suas suposições sobre crescimento, margens e despesas para determinar o valor intrínseco da Sichuan Changhong Electric Co., Ltd. (600839Ss) e refine sua abordagem de investimento.
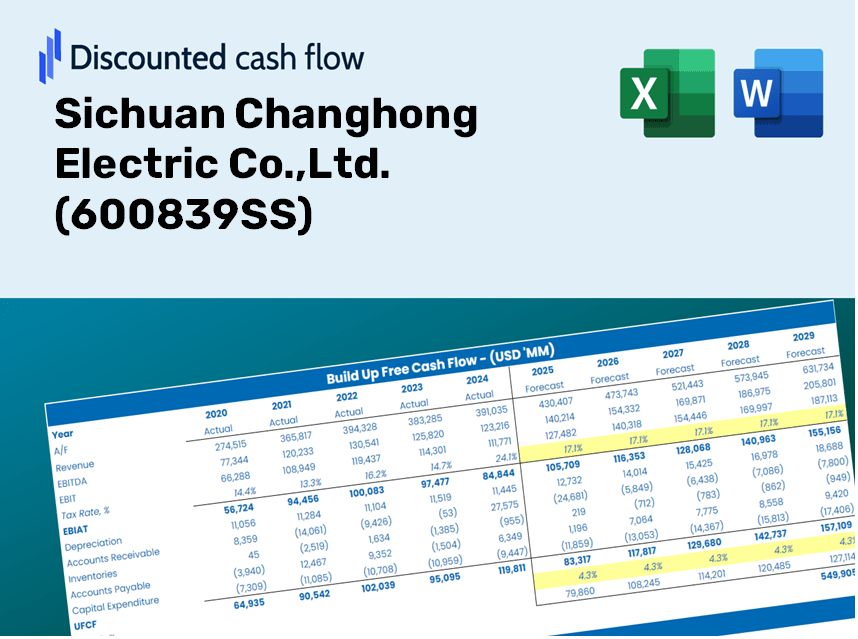
Discounted Cash Flow (DCF) - (USD MM)
| Year | AY1 2020 |
AY2 2021 |
AY3 2022 |
AY4 2023 |
AY5 2024 |
FY1 2025 |
FY2 2026 |
FY3 2027 |
FY4 2028 |
FY5 2029 |
|---|---|---|---|---|---|---|---|---|---|---|
| Revenue | 94,448.2 | 99,631.9 | 92,481.7 | 97,455.8 | 103,691.2 | 106,306.4 | 108,987.5 | 111,736.3 | 114,554.4 | 117,443.6 |
| Revenue Growth, % | 0 | 5.49 | -7.18 | 5.38 | 6.4 | 2.52 | 2.52 | 2.52 | 2.52 | 2.52 |
| EBITDA | 1,515.3 | 1,980.2 | 2,499.3 | 2,869.8 | 2,795.5 | 2,537.6 | 2,601.6 | 2,667.2 | 2,734.4 | 2,803.4 |
| EBITDA, % | 1.6 | 1.99 | 2.7 | 2.94 | 2.7 | 2.39 | 2.39 | 2.39 | 2.39 | 2.39 |
| Depreciation | 1,115.6 | 1,199.1 | 1,126.1 | 1,292.1 | 1,116.6 | 1,276.7 | 1,308.9 | 1,342.0 | 1,375.8 | 1,410.5 |
| Depreciation, % | 1.18 | 1.2 | 1.22 | 1.33 | 1.08 | 1.2 | 1.2 | 1.2 | 1.2 | 1.2 |
| EBIT | 399.7 | 781.1 | 1,373.3 | 1,577.7 | 1,678.9 | 1,260.8 | 1,292.6 | 1,325.2 | 1,358.6 | 1,392.9 |
| EBIT, % | 0.42324 | 0.78395 | 1.48 | 1.62 | 1.62 | 1.19 | 1.19 | 1.19 | 1.19 | 1.19 |
| Total Cash | 20,669.0 | 21,921.6 | 21,915.9 | 26,382.2 | 25,621.3 | 25,378.4 | 26,018.4 | 26,674.7 | 27,347.4 | 28,037.2 |
| Total Cash, percent | .0 | .0 | .0 | .0 | .0 | .0 | .0 | .0 | .0 | .0 |
| Account Receivables | 14,894.1 | 14,598.6 | 15,118.8 | 18,183.9 | 19,100.7 | 17,827.4 | 18,277.1 | 18,738.0 | 19,210.6 | 19,695.1 |
| Account Receivables, % | 15.77 | 14.65 | 16.35 | 18.66 | 18.42 | 16.77 | 16.77 | 16.77 | 16.77 | 16.77 |
| Inventories | 17,657.6 | 17,320.7 | 18,887.2 | 19,547.1 | 22,864.7 | 20,966.0 | 21,494.7 | 22,036.9 | 22,592.7 | 23,162.5 |
| Inventories, % | 18.7 | 17.38 | 20.42 | 20.06 | 22.05 | 19.72 | 19.72 | 19.72 | 19.72 | 19.72 |
| Accounts Payable | 24,334.8 | 31,339.6 | 34,848.5 | 41,546.6 | 47,189.5 | 38,917.3 | 39,898.8 | 40,905.1 | 41,936.8 | 42,994.4 |
| Accounts Payable, % | 25.77 | 31.46 | 37.68 | 42.63 | 45.51 | 36.61 | 36.61 | 36.61 | 36.61 | 36.61 |
| Capital Expenditure | -814.7 | -1,072.4 | -1,021.2 | -1,570.8 | -955.1 | -1,185.5 | -1,215.4 | -1,246.1 | -1,277.5 | -1,309.7 |
| Capital Expenditure, % | -0.86259 | -1.08 | -1.1 | -1.61 | -0.92107 | -1.12 | -1.12 | -1.12 | -1.12 | -1.12 |
| Tax Rate, % | 65.43 | 65.43 | 65.43 | 65.43 | 65.43 | 65.43 | 65.43 | 65.43 | 65.43 | 65.43 |
| EBITAT | 41.1 | 250.3 | 443.8 | 532.1 | 580.5 | 360.4 | 369.5 | 378.8 | 388.4 | 398.2 |
| Depreciation | ||||||||||
| Changes in Account Receivables | ||||||||||
| Changes in Inventories | ||||||||||
| Changes in Accounts Payable | ||||||||||
| Capital Expenditure | ||||||||||
| UFCF | -7,875.0 | 8,014.3 | 1,970.9 | 3,226.4 | 2,150.5 | -4,648.6 | 466.2 | 477.9 | 490.0 | 502.3 |
| WACC, % | 3.6 | 3.85 | 3.85 | 3.87 | 3.88 | 3.81 | 3.81 | 3.81 | 3.81 | 3.81 |
| PV UFCF | ||||||||||
| SUM PV UFCF | -2,779.7 | |||||||||
| Long Term Growth Rate, % | 2.00 | |||||||||
| Free cash flow (T + 1) | 512 | |||||||||
| Terminal Value | 28,300 | |||||||||
| Present Terminal Value | 23,473 | |||||||||
| Enterprise Value | 20,694 | |||||||||
| Net Debt | -11,460 | |||||||||
| Equity Value | 32,154 | |||||||||
| Diluted Shares Outstanding, MM | 4,616 | |||||||||
| Equity Value Per Share | 6.97 |
What You Will Receive
- Authentic 600839SS Financials: Access to both historical and projected data for precise valuation.
- Customizable Inputs: Adjust parameters such as WACC, tax rates, revenue growth, and capital expenditures.
- Automated Calculations: Intrinsic value and NPV are calculated in real-time.
- Scenario Analysis: Evaluate multiple scenarios to assess Sichuan Changhong's future outlook.
- User-Friendly Design: Designed for professionals but easy enough for newcomers.
Key Features
- Authentic Financial Data for Sichuan Changhong: Obtain precise historical information and future estimates tailored for [600839SS].
- Customizable Projection Assumptions: Adjust highlighted cells to fit your needs, including WACC, growth rates, and profit margins.
- Automated Calculations: Enjoy real-time updates for DCF, Net Present Value (NPV), and cash flow evaluations.
- User-Friendly Dashboard: Access straightforward charts and summaries for a clear view of your valuation outcomes.
- Designed for All Skill Levels: A straightforward and intuitive framework created for investors, CFOs, and advisors alike.
How It Works
- 1. Access the Template: Download and open the Excel file containing preloaded data for Sichuan Changhong Electric Co., Ltd. (600839SS).
- 2. Modify Assumptions: Adjust key variables such as growth rates, WACC, and capital expenditures to fit your analysis.
- 3. View Results in Real-Time: The DCF model automatically calculates intrinsic value and NPV based on your inputs.
- 4. Explore Different Scenarios: Evaluate various forecasts to understand a range of valuation possibilities.
- 5. Present Confidently: Share professional valuation insights to inform and enhance your decision-making process.
Why Opt for the Sichuan Changhong Electric Co., Ltd. Calculator?
- Precision: Utilizes actual financial data from Sichuan Changhong Electric for reliable results.
- Customizability: Tailored for users to easily adjust and experiment with various inputs.
- Efficiency: Eliminate the need to construct a financial model from the ground up.
- High Standards: Crafted with the accuracy and functionality expected from a top-tier financial tool.
- Intuitive: User-friendly interface designed for individuals with any level of financial modeling experience.
Who Can Benefit from Sichuan Changhong Electric Co., Ltd. (600839SS)?
- Investors: Make informed investment choices with our comprehensive analysis tools.
- Financial Analysts: Streamline your workflow with our customizable financial models.
- Consultants: Efficiently modify reports and presentations for your clients’ needs.
- Finance Enthusiasts: Enhance your knowledge of market dynamics through practical insights.
- Educators and Students: Utilize our resources as a hands-on learning aid in finance studies.
Contents of the Template
- Pre-Filled Data: Contains Sichuan Changhong Electric's historical financials and forecasts.
- Discounted Cash Flow Model: An editable DCF valuation model with automatic calculations.
- Weighted Average Cost of Capital (WACC): A dedicated sheet for WACC calculations based on user-defined inputs.
- Key Financial Ratios: Evaluate Sichuan Changhong Electric's profitability, efficiency, and capital structure.
- Customizable Inputs: Easily adjust revenue growth, margins, and tax rates.
- Clear Dashboard: Visualizations and tables summarizing essential valuation outcomes.
Disclaimer
All information, articles, and product details provided on this website are for general informational and educational purposes only. We do not claim any ownership over, nor do we intend to infringe upon, any trademarks, copyrights, logos, brand names, or other intellectual property mentioned or depicted on this site. Such intellectual property remains the property of its respective owners, and any references here are made solely for identification or informational purposes, without implying any affiliation, endorsement, or partnership.
We make no representations or warranties, express or implied, regarding the accuracy, completeness, or suitability of any content or products presented. Nothing on this website should be construed as legal, tax, investment, financial, medical, or other professional advice. In addition, no part of this site—including articles or product references—constitutes a solicitation, recommendation, endorsement, advertisement, or offer to buy or sell any securities, franchises, or other financial instruments, particularly in jurisdictions where such activity would be unlawful.
All content is of a general nature and may not address the specific circumstances of any individual or entity. It is not a substitute for professional advice or services. Any actions you take based on the information provided here are strictly at your own risk. You accept full responsibility for any decisions or outcomes arising from your use of this website and agree to release us from any liability in connection with your use of, or reliance upon, the content or products found herein.