
|
Mongólia Interior Mengdian Huaneng Thermal Power Corporation Limited (600863.SS) Avaliação DCF |
Totalmente Editável: Adapte-Se Às Suas Necessidades No Excel Ou Planilhas
Design Profissional: Modelos Confiáveis E Padrão Da Indústria
Pré-Construídos Para Uso Rápido E Eficiente
Compatível com MAC/PC, totalmente desbloqueado
Não É Necessária Experiência; Fácil De Seguir
Inner Mongolia MengDian HuaNeng Thermal Power Corporation Limited (600863.SS) Bundle
Simplifique sua análise e melhore a precisão com a calculadora DCF (600863SS)! Equipado com Mongólia Interior Mongólia Mengdiana Huaneng Termal Power Corporation Dados limitados e suposições personalizáveis, essa ferramenta permite que você preveja, avalie e valorize (600863Ss) como um investidor experiente.
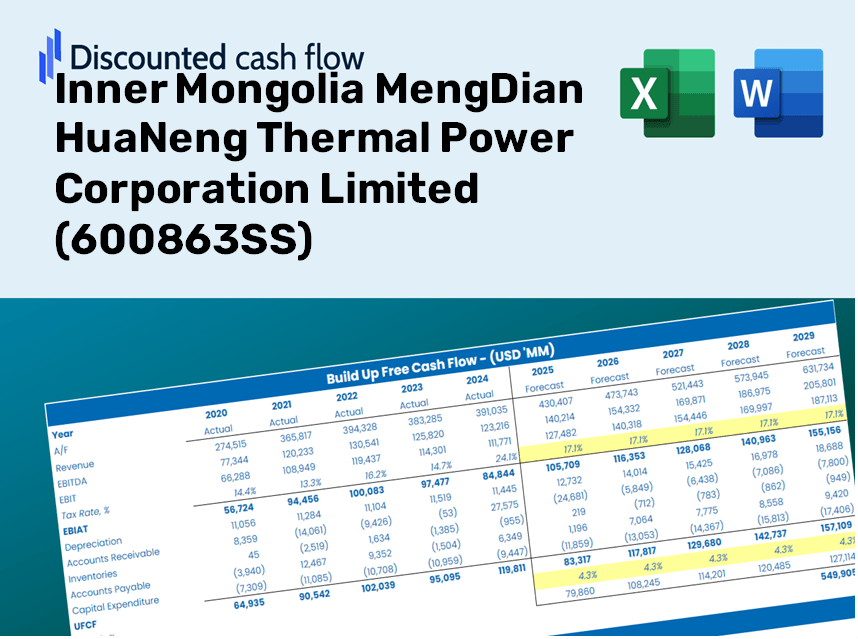
Discounted Cash Flow (DCF) - (USD MM)
| Year | AY1 2020 |
AY2 2021 |
AY3 2022 |
AY4 2023 |
AY5 2024 |
FY1 2025 |
FY2 2026 |
FY3 2027 |
FY4 2028 |
FY5 2029 |
|---|---|---|---|---|---|---|---|---|---|---|
| Revenue | 15,360.6 | 19,001.3 | 23,065.6 | 22,525.3 | 22,293.6 | 22,367.5 | 22,441.7 | 22,516.0 | 22,590.6 | 22,665.5 |
| Revenue Growth, % | 0 | 23.7 | 21.39 | -2.34 | -1.03 | 0.33142 | 0.33142 | 0.33142 | 0.33142 | 0.33142 |
| EBITDA | 4,377.6 | 3,965.9 | 5,983.8 | 6,399.4 | 5,664.0 | 5,776.6 | 5,795.8 | 5,815.0 | 5,834.3 | 5,853.6 |
| EBITDA, % | 28.5 | 20.87 | 25.94 | 28.41 | 25.41 | 25.83 | 25.83 | 25.83 | 25.83 | 25.83 |
| Depreciation | 2,616.5 | 2,681.1 | 2,811.1 | 2,639.2 | 2,305.0 | 2,925.1 | 2,934.8 | 2,944.5 | 2,954.3 | 2,964.1 |
| Depreciation, % | 17.03 | 14.11 | 12.19 | 11.72 | 10.34 | 13.08 | 13.08 | 13.08 | 13.08 | 13.08 |
| EBIT | 1,761.1 | 1,284.9 | 3,172.7 | 3,760.3 | 3,359.0 | 2,851.5 | 2,861.0 | 2,870.5 | 2,880.0 | 2,889.5 |
| EBIT, % | 11.46 | 6.76 | 13.75 | 16.69 | 15.07 | 12.75 | 12.75 | 12.75 | 12.75 | 12.75 |
| Total Cash | 294.9 | 778.3 | 974.4 | 1,594.9 | 709.3 | 917.2 | 920.2 | 923.3 | 926.3 | 929.4 |
| Total Cash, percent | .0 | .0 | .0 | .0 | .0 | .0 | .0 | .0 | .0 | .0 |
| Account Receivables | 2,733.6 | 3,761.9 | 4,188.6 | 4,748.9 | 4,933.8 | 4,427.3 | 4,442.0 | 4,456.7 | 4,471.5 | 4,486.3 |
| Account Receivables, % | 17.8 | 19.8 | 18.16 | 21.08 | 22.13 | 19.79 | 19.79 | 19.79 | 19.79 | 19.79 |
| Inventories | 372.1 | 590.2 | 522.6 | 304.3 | 555.4 | 520.5 | 522.3 | 524.0 | 525.7 | 527.5 |
| Inventories, % | 2.42 | 3.11 | 2.27 | 1.35 | 2.49 | 2.33 | 2.33 | 2.33 | 2.33 | 2.33 |
| Accounts Payable | 2,233.4 | 2,319.8 | 2,680.6 | 2,068.7 | 1,931.6 | 2,514.9 | 2,523.3 | 2,531.6 | 2,540.0 | 2,548.4 |
| Accounts Payable, % | 14.54 | 12.21 | 11.62 | 9.18 | 8.66 | 11.24 | 11.24 | 11.24 | 11.24 | 11.24 |
| Capital Expenditure | -1,159.1 | -1,023.5 | -1,183.5 | -2,389.9 | -3,749.0 | -2,035.0 | -2,041.7 | -2,048.5 | -2,055.3 | -2,062.1 |
| Capital Expenditure, % | -7.55 | -5.39 | -5.13 | -10.61 | -16.82 | -9.1 | -9.1 | -9.1 | -9.1 | -9.1 |
| Tax Rate, % | 19.16 | 19.16 | 19.16 | 19.16 | 19.16 | 19.16 | 19.16 | 19.16 | 19.16 | 19.16 |
| EBITAT | 1,457.9 | 1,170.1 | 2,354.6 | 2,984.5 | 2,715.4 | 2,328.4 | 2,336.1 | 2,343.9 | 2,351.6 | 2,359.4 |
| Depreciation | ||||||||||
| Changes in Account Receivables | ||||||||||
| Changes in Inventories | ||||||||||
| Changes in Accounts Payable | ||||||||||
| Capital Expenditure | ||||||||||
| UFCF | 2,043.1 | 1,667.7 | 3,983.9 | 2,279.8 | 698.3 | 4,343.2 | 3,221.1 | 3,231.8 | 3,242.5 | 3,253.3 |
| WACC, % | 4.13 | 4.21 | 4.05 | 4.1 | 4.11 | 4.12 | 4.12 | 4.12 | 4.12 | 4.12 |
| PV UFCF | ||||||||||
| SUM PV UFCF | 15,422.3 | |||||||||
| Long Term Growth Rate, % | 1.00 | |||||||||
| Free cash flow (T + 1) | 3,286 | |||||||||
| Terminal Value | 105,237 | |||||||||
| Present Terminal Value | 85,990 | |||||||||
| Enterprise Value | 101,412 | |||||||||
| Net Debt | 9,315 | |||||||||
| Equity Value | 92,097 | |||||||||
| Diluted Shares Outstanding, MM | 6,839 | |||||||||
| Equity Value Per Share | 13.47 |
What You Will Receive
- Genuine (600863SS) Financial Data: Pre-populated with historical and forecasted metrics for accurate analysis.
- Completely Customizable Template: Easily adjust key factors such as revenue growth, WACC, and EBITDA percentage.
- Instant Calculations: Watch as the intrinsic value of (600863SS) refreshes in real-time with your modifications.
- Expert Valuation Tool: Crafted for investors, analysts, and consultants aiming for precise DCF results.
- Intuitive Design: Streamlined layout and straightforward instructions suitable for all skill levels.
Key Features
- Authentic Financial Data for (600863SS): Gain access to reliable historical figures and future forecasts directly related to Inner Mongolia MengDian HuaNeng Thermal Power Corporation Limited.
- Tailorable Forecast Inputs: Modify the highlighted cells, including WACC, growth rates, and profit margins, to fit your analysis needs.
- Real-Time Calculations: Experience automatic updates for DCF, Net Present Value (NPV), and cash flow assessments as you adjust variables.
- User-Friendly Dashboard: View your valuation outcomes through straightforward charts and summaries designed for clarity.
- Suitable for All Skill Levels: An intuitive layout designed for investors, CFOs, and consultants, from novices to seasoned professionals.
How It Works
- 1. Access the Template: Download and open the Excel file containing the preloaded data for Inner Mongolia MengDian HuaNeng Thermal Power Corporation Limited (600863SS).
- 2. Adjust Assumptions: Modify key parameters such as growth rates, WACC, and capital expenditures to fit your analysis.
- 3. Get Instant Results: The DCF model automatically computes the intrinsic value and NPV based on your inputs.
- 4. Explore Different Scenarios: Test various forecasts to evaluate a range of valuation outcomes.
- 5. Present with Confidence: Use the professional valuation insights to strengthen your decision-making process.
Why Select the Inner Mongolia MengDian HuaNeng Thermal Power Calculator?
- Time Efficient: Skip the hassle of developing a DCF model from the ground up – it’s immediately ready to use.
- Enhanced Accuracy: Dependable financial data and formulas minimize valuation errors.
- Completely Customizable: Adjust the model to align with your specific assumptions and forecasts.
- Simple to Analyze: Intuitive charts and outputs ensure easy interpretation of results.
- Backed by Professionals: Crafted for experts who prioritize precision and ease of use.
Who Should Benefit from This Product?
- Individual Investors: Gain insights for making informed decisions regarding the buying or selling of Inner Mongolia MengDian HuaNeng Thermal Power Corporation Limited (600863SS) stock.
- Financial Analysts: Enhance valuation methodologies with readily available financial models tailored for Inner Mongolia MengDian HuaNeng Thermal Power Corporation Limited (600863SS).
- Consultants: Provide clients with accurate and timely valuation analysis for Inner Mongolia MengDian HuaNeng Thermal Power Corporation Limited (600863SS).
- Business Owners: Learn how large corporations like Inner Mongolia MengDian HuaNeng Thermal Power Corporation Limited (600863SS) are appraised to inform your own business strategies.
- Finance Students: Acquire practical skills in valuation using authentic data and scenarios from Inner Mongolia MengDian HuaNeng Thermal Power Corporation Limited (600863SS).
Contents of the Template
- In-Depth DCF Model: Fully editable template featuring extensive valuation calculations.
- Historical and Projected Data: Inner Mongolia MengDian HuaNeng Thermal Power's historical and forecasted financials pre-loaded for in-depth analysis.
- Adjustable Assumptions: Customize WACC, growth rates, and tax rates to explore various scenarios.
- Detailed Financial Statements: Comprehensive annual and quarterly reports for enhanced insights.
- Essential Ratios: Integrated analysis for evaluating profitability, efficiency, and leverage.
- Interactive Dashboard: Visual representations including charts and tables for straightforward, actionable insights.
Disclaimer
All information, articles, and product details provided on this website are for general informational and educational purposes only. We do not claim any ownership over, nor do we intend to infringe upon, any trademarks, copyrights, logos, brand names, or other intellectual property mentioned or depicted on this site. Such intellectual property remains the property of its respective owners, and any references here are made solely for identification or informational purposes, without implying any affiliation, endorsement, or partnership.
We make no representations or warranties, express or implied, regarding the accuracy, completeness, or suitability of any content or products presented. Nothing on this website should be construed as legal, tax, investment, financial, medical, or other professional advice. In addition, no part of this site—including articles or product references—constitutes a solicitation, recommendation, endorsement, advertisement, or offer to buy or sell any securities, franchises, or other financial instruments, particularly in jurisdictions where such activity would be unlawful.
All content is of a general nature and may not address the specific circumstances of any individual or entity. It is not a substitute for professional advice or services. Any actions you take based on the information provided here are strictly at your own risk. You accept full responsibility for any decisions or outcomes arising from your use of this website and agree to release us from any liability in connection with your use of, or reliance upon, the content or products found herein.