
|
Extremo East Smarter Energy Co., Ltd. (600869.Ss) Avaliação DCF |
Totalmente Editável: Adapte-Se Às Suas Necessidades No Excel Ou Planilhas
Design Profissional: Modelos Confiáveis E Padrão Da Indústria
Pré-Construídos Para Uso Rápido E Eficiente
Compatível com MAC/PC, totalmente desbloqueado
Não É Necessária Experiência; Fácil De Seguir
Far East Smarter Energy Co., Ltd. (600869.SS) Bundle
Simplifique o Extremo Oriental Smarter Energy Co., Ltd. Avaliação com esta calculadora DCF personalizável! Apresentando o Real Far East Smarter Energy Co., Ltd. Financeiras e insumos de previsão ajustáveis, você pode testar cenários e descobrir o Extremo East Smarter Energy Co., Ltd. Valor justo em minutos.
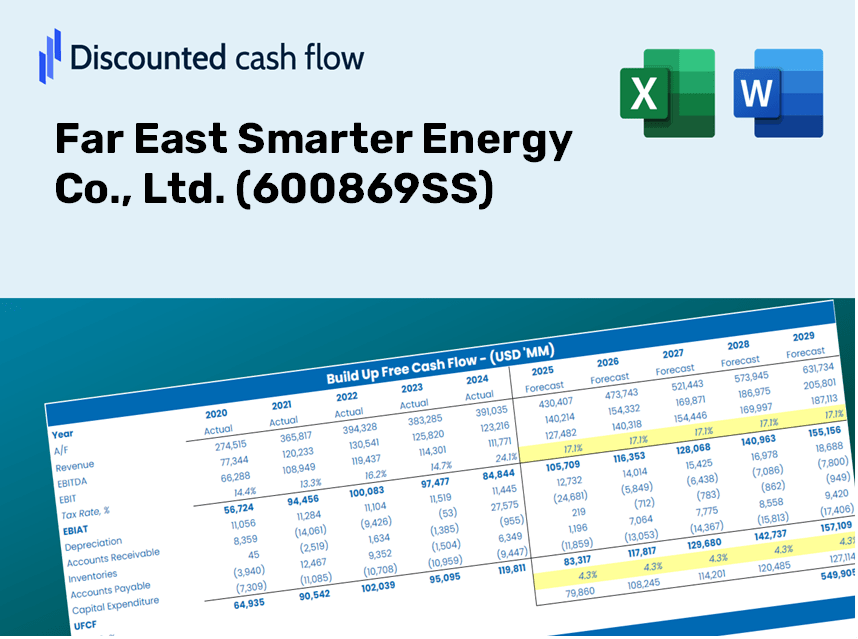
Discounted Cash Flow (DCF) - (USD MM)
| Year | AY1 2020 |
AY2 2021 |
AY3 2022 |
AY4 2023 |
AY5 2024 |
FY1 2025 |
FY2 2026 |
FY3 2027 |
FY4 2028 |
FY5 2029 |
|---|---|---|---|---|---|---|---|---|---|---|
| Revenue | 19,804.1 | 20,871.3 | 21,679.7 | 24,464.8 | 26,093.7 | 27,508.3 | 28,999.7 | 30,571.9 | 32,229.3 | 33,976.6 |
| Revenue Growth, % | 0 | 5.39 | 3.87 | 12.85 | 6.66 | 5.42 | 5.42 | 5.42 | 5.42 | 5.42 |
| EBITDA | 359.3 | 1,262.0 | 1,082.3 | 1,008.3 | 428.1 | 1,024.1 | 1,079.7 | 1,138.2 | 1,199.9 | 1,264.9 |
| EBITDA, % | 1.81 | 6.05 | 4.99 | 4.12 | 1.64 | 3.72 | 3.72 | 3.72 | 3.72 | 3.72 |
| Depreciation | 442.5 | 389.4 | 340.6 | 361.3 | 379.6 | 473.3 | 498.9 | 526.0 | 554.5 | 584.6 |
| Depreciation, % | 2.23 | 1.87 | 1.57 | 1.48 | 1.45 | 1.72 | 1.72 | 1.72 | 1.72 | 1.72 |
| EBIT | -83.2 | 872.6 | 741.7 | 647.0 | 48.5 | 550.8 | 580.7 | 612.2 | 645.4 | 680.4 |
| EBIT, % | -0.4199 | 4.18 | 3.42 | 2.64 | 0.18581 | 2 | 2 | 2 | 2 | 2 |
| Total Cash | 3,249.5 | 3,686.4 | 4,318.5 | 3,450.2 | 2,816.2 | 4,340.0 | 4,575.3 | 4,823.4 | 5,084.9 | 5,360.6 |
| Total Cash, percent | .0 | .0 | .0 | .0 | .0 | .0 | .0 | .0 | .0 | .0 |
| Account Receivables | 5,762.2 | 6,336.9 | 5,612.5 | 6,882.3 | 7,436.6 | 7,811.1 | 8,234.6 | 8,681.0 | 9,151.7 | 9,647.8 |
| Account Receivables, % | 29.1 | 30.36 | 25.89 | 28.13 | 28.5 | 28.4 | 28.4 | 28.4 | 28.4 | 28.4 |
| Inventories | 1,955.6 | 2,612.8 | 2,573.9 | 2,903.2 | 2,737.9 | 3,115.3 | 3,284.2 | 3,462.3 | 3,650.0 | 3,847.9 |
| Inventories, % | 9.87 | 12.52 | 11.87 | 11.87 | 10.49 | 11.33 | 11.33 | 11.33 | 11.33 | 11.33 |
| Accounts Payable | 4,354.8 | 4,928.3 | 4,885.2 | 5,395.6 | 4,322.3 | 5,873.3 | 6,191.7 | 6,527.4 | 6,881.3 | 7,254.4 |
| Accounts Payable, % | 21.99 | 23.61 | 22.53 | 22.05 | 16.56 | 21.35 | 21.35 | 21.35 | 21.35 | 21.35 |
| Capital Expenditure | -416.1 | -288.9 | -616.8 | -1,161.6 | -852.2 | -789.2 | -831.9 | -877.0 | -924.6 | -974.7 |
| Capital Expenditure, % | -2.1 | -1.38 | -2.85 | -4.75 | -3.27 | -2.87 | -2.87 | -2.87 | -2.87 | -2.87 |
| Tax Rate, % | 15.12 | 15.12 | 15.12 | 15.12 | 15.12 | 15.12 | 15.12 | 15.12 | 15.12 | 15.12 |
| EBITAT | -96.5 | 658.6 | 628.0 | 514.4 | 41.2 | 467.7 | 493.1 | 519.8 | 548.0 | 577.7 |
| Depreciation | ||||||||||
| Changes in Account Receivables | ||||||||||
| Changes in Inventories | ||||||||||
| Changes in Accounts Payable | ||||||||||
| Capital Expenditure | ||||||||||
| UFCF | -3,433.0 | 100.6 | 1,071.9 | -1,374.5 | -1,893.7 | 950.9 | -113.9 | -120.1 | -126.6 | -133.4 |
| WACC, % | 5.22 | 4.78 | 4.95 | 4.86 | 4.95 | 4.95 | 4.95 | 4.95 | 4.95 | 4.95 |
| PV UFCF | ||||||||||
| SUM PV UFCF | 489.6 | |||||||||
| Long Term Growth Rate, % | 3.50 | |||||||||
| Free cash flow (T + 1) | -138 | |||||||||
| Terminal Value | -9,517 | |||||||||
| Present Terminal Value | -7,474 | |||||||||
| Enterprise Value | -6,985 | |||||||||
| Net Debt | 3,654 | |||||||||
| Equity Value | -10,638 | |||||||||
| Diluted Shares Outstanding, MM | 2,219 | |||||||||
| Equity Value Per Share | -4.79 |
What You Will Receive
- Pre-Loaded Financial Model: Utilize Far East Smarter Energy's actual data for accurate DCF valuation.
- Comprehensive Forecast Control: Modify revenue growth, profit margins, WACC, and other essential factors.
- Real-Time Calculations: Automatic updates provide immediate insights as you adjust parameters.
- Professional-Grade Template: An expertly crafted Excel file tailored for high-quality valuation.
- Flexible and Reusable: Designed for adaptability, allowing for multiple uses in detailed forecasting scenarios.
Key Features
- Comprehensive Historical Data: Access Far East Smarter Energy Co., Ltd.’s (600869SS) past financial statements and pre-filled projections.
- Customizable Parameters: Modify WACC, tax rates, revenue growth, and EBITDA margins according to your analysis needs.
- Real-Time Valuation: Instantly view recalculated intrinsic value for Far East Smarter Energy Co., Ltd. (600869SS) as you adjust inputs.
- Intuitive Visualizations: Dashboard charts effectively illustrate valuation metrics and critical insights.
- Designed for Precision: A robust tool tailored for analysts, investors, and financial professionals.
How It Works
- Download the Template: Gain immediate access to the Excel-based Far East Smarter Energy DCF Calculator.
- Input Your Assumptions: Modify the yellow-highlighted cells for growth rates, WACC, margins, and other key parameters.
- Instant Calculations: The model will automatically refresh the intrinsic value of Far East Smarter Energy (600869SS).
- Test Scenarios: Experiment with various assumptions to analyze potential shifts in valuation.
- Analyze and Decide: Leverage the outcomes to inform your investment strategies or financial evaluations.
Why Choose This Calculator for Far East Smarter Energy Co., Ltd. (600869SS)?
- User-Friendly Interface: Crafted for both novices and seasoned professionals.
- Customizable Inputs: Adjust parameters effortlessly to tailor your analysis.
- Real-Time Valuation: Observe immediate updates to Far East Smarter Energy’s value as you modify inputs.
- Preloaded Financials: Comes equipped with Far East Smarter Energy’s latest financial data for swift evaluation.
- Preferred by Experts: Trusted by investors and analysts for making strategic decisions.
Who Can Benefit from Our Services?
- Individual Investors: Equip yourself to make informed decisions regarding investments in Far East Smarter Energy Co., Ltd. (600869SS).
- Financial Analysts: Enhance your valuation processes with comprehensive financial models tailored for the energy sector.
- Consultants: Provide your clients with accurate and timely insights into the valuation of Far East Smarter Energy Co., Ltd. (600869SS).
- Business Owners: Gain insights into how major energy companies like Far East Smarter Energy Co., Ltd. (600869SS) are valued to inform your own business strategies.
- Finance Students: Explore real-world valuation methods and strategies using data from Far East Smarter Energy Co., Ltd. (600869SS).
Contents of the Template
- Historical Data: Comprises past financial information and baseline forecasts for Far East Smarter Energy Co., Ltd. (600869SS).
- DCF and Levered DCF Models: Comprehensive templates designed to determine the intrinsic value of Far East Smarter Energy Co., Ltd. (600869SS).
- WACC Sheet: Ready-to-use calculations for the Weighted Average Cost of Capital.
- Editable Inputs: Adjust crucial factors such as growth rates, EBITDA percentages, and CAPEX assumptions.
- Quarterly and Annual Statements: An in-depth analysis of the financials of Far East Smarter Energy Co., Ltd. (600869SS).
- Interactive Dashboard: Dynamically visualize valuation outcomes and projections.
Disclaimer
All information, articles, and product details provided on this website are for general informational and educational purposes only. We do not claim any ownership over, nor do we intend to infringe upon, any trademarks, copyrights, logos, brand names, or other intellectual property mentioned or depicted on this site. Such intellectual property remains the property of its respective owners, and any references here are made solely for identification or informational purposes, without implying any affiliation, endorsement, or partnership.
We make no representations or warranties, express or implied, regarding the accuracy, completeness, or suitability of any content or products presented. Nothing on this website should be construed as legal, tax, investment, financial, medical, or other professional advice. In addition, no part of this site—including articles or product references—constitutes a solicitation, recommendation, endorsement, advertisement, or offer to buy or sell any securities, franchises, or other financial instruments, particularly in jurisdictions where such activity would be unlawful.
All content is of a general nature and may not address the specific circumstances of any individual or entity. It is not a substitute for professional advice or services. Any actions you take based on the information provided here are strictly at your own risk. You accept full responsibility for any decisions or outcomes arising from your use of this website and agree to release us from any liability in connection with your use of, or reliance upon, the content or products found herein.