
|
Shanghai Zhangjiang Hi-Tech Park Development Co., Ltd. (600895.Ss) DCF Avaliação |
Totalmente Editável: Adapte-Se Às Suas Necessidades No Excel Ou Planilhas
Design Profissional: Modelos Confiáveis E Padrão Da Indústria
Pré-Construídos Para Uso Rápido E Eficiente
Compatível com MAC/PC, totalmente desbloqueado
Não É Necessária Experiência; Fácil De Seguir
Shanghai Zhangjiang Hi-Tech Park Development Co., Ltd. (600895.SS) Bundle
Explore o potencial financeiro de Shanghai Zhangjiang Hi-Tech Park Development Co., Ltd. (600895Ss) com nossa calculadora DCF amigável! Digite suas expectativas de crescimento, margens de lucro e despesas para calcular o valor intrínseco de Shanghai Zhangjiang Hi-Tech Park Development Co., Ltd. (600895Ss) e informe sua estratégia de investimento.
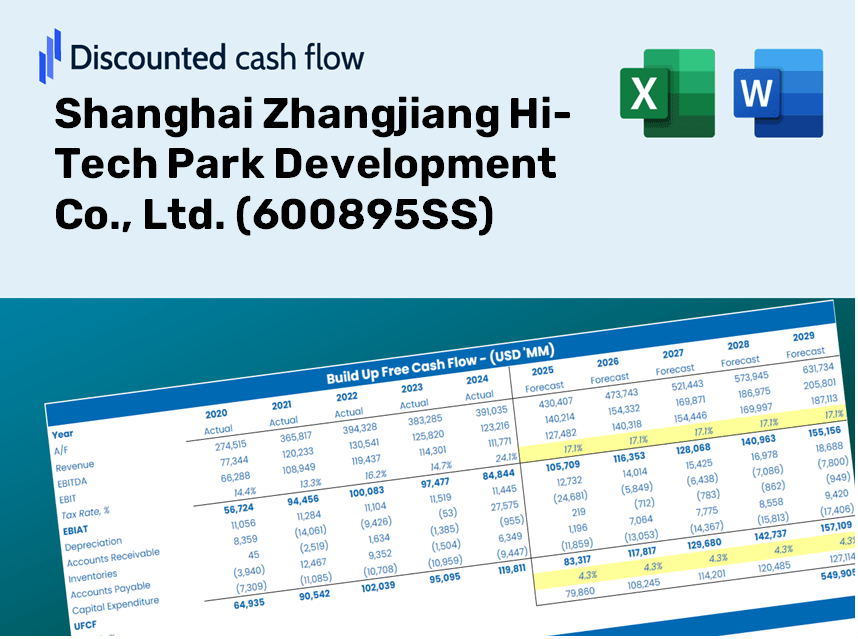
Discounted Cash Flow (DCF) - (USD MM)
| Year | AY1 2020 |
AY2 2021 |
AY3 2022 |
AY4 2023 |
AY5 2024 |
FY1 2025 |
FY2 2026 |
FY3 2027 |
FY4 2028 |
FY5 2029 |
|---|---|---|---|---|---|---|---|---|---|---|
| Revenue | 779.2 | 2,097.1 | 1,906.7 | 2,025.7 | 1,983.3 | 2,454.7 | 3,038.1 | 3,760.2 | 4,653.9 | 5,760.0 |
| Revenue Growth, % | 0 | 169.13 | -9.08 | 6.24 | -2.09 | 23.77 | 23.77 | 23.77 | 23.77 | 23.77 |
| EBITDA | 576.7 | 1,569.1 | 1,038.1 | 1,200.5 | 969.5 | 1,529.0 | 1,892.4 | 2,342.1 | 2,898.8 | 3,587.8 |
| EBITDA, % | 74.02 | 74.83 | 54.45 | 59.26 | 48.88 | 62.29 | 62.29 | 62.29 | 62.29 | 62.29 |
| Depreciation | 251.0 | 267.2 | 293.5 | 268.4 | 274.5 | 429.3 | 531.3 | 657.6 | 813.9 | 1,007.3 |
| Depreciation, % | 32.22 | 12.74 | 15.39 | 13.25 | 13.84 | 17.49 | 17.49 | 17.49 | 17.49 | 17.49 |
| EBIT | 325.7 | 1,302.0 | 744.7 | 932.1 | 695.0 | 1,099.7 | 1,361.0 | 1,684.5 | 2,084.9 | 2,580.4 |
| EBIT, % | 41.8 | 62.09 | 39.06 | 46.01 | 35.04 | 44.8 | 44.8 | 44.8 | 44.8 | 44.8 |
| Total Cash | 3,566.4 | 3,086.6 | 3,465.2 | 3,939.3 | 2,728.9 | 2,454.7 | 3,038.1 | 3,760.2 | 4,653.9 | 5,760.0 |
| Total Cash, percent | .0 | .0 | .0 | .0 | .0 | .0 | .0 | .0 | .0 | .0 |
| Account Receivables | 146.1 | 328.9 | 219.4 | 275.9 | 374.4 | 385.1 | 476.6 | 589.8 | 730.0 | 903.5 |
| Account Receivables, % | 18.74 | 15.68 | 11.51 | 13.62 | 18.88 | 15.69 | 15.69 | 15.69 | 15.69 | 15.69 |
| Inventories | 7,828.7 | 9,075.8 | 11,852.5 | 17,165.5 | 19,360.5 | 2,454.7 | 3,038.1 | 3,760.2 | 4,653.9 | 5,760.0 |
| Inventories, % | 1004.72 | 432.79 | 621.61 | 847.37 | 976.17 | 100 | 100 | 100 | 100 | 100 |
| Accounts Payable | 575.7 | 1,187.8 | 2,367.9 | 4,841.3 | 8,013.8 | 2,113.6 | 2,615.9 | 3,237.7 | 4,007.2 | 4,959.6 |
| Accounts Payable, % | 73.88 | 56.64 | 124.19 | 238.99 | 404.07 | 86.1 | 86.1 | 86.1 | 86.1 | 86.1 |
| Capital Expenditure | -541.5 | -990.2 | -1,589.7 | -1,948.5 | -2,061.9 | -1,945.5 | -2,407.9 | -2,980.2 | -3,688.5 | -4,565.2 |
| Capital Expenditure, % | -69.5 | -47.22 | -83.38 | -96.19 | -103.96 | -79.26 | -79.26 | -79.26 | -79.26 | -79.26 |
| Tax Rate, % | 22.95 | 22.95 | 22.95 | 22.95 | 22.95 | 22.95 | 22.95 | 22.95 | 22.95 | 22.95 |
| EBITAT | 250.6 | 1,105.1 | 656.1 | 673.5 | 535.5 | 878.0 | 1,086.7 | 1,345.0 | 1,664.7 | 2,060.4 |
| Depreciation | ||||||||||
| Changes in Account Receivables | ||||||||||
| Changes in Inventories | ||||||||||
| Changes in Accounts Payable | ||||||||||
| Capital Expenditure | ||||||||||
| UFCF | -7,439.0 | -435.7 | -2,127.3 | -3,902.7 | -372.8 | 10,356.7 | -962.4 | -1,191.2 | -1,474.3 | -1,824.7 |
| WACC, % | 6.17 | 6.24 | 6.27 | 6.12 | 6.17 | 6.2 | 6.2 | 6.2 | 6.2 | 6.2 |
| PV UFCF | ||||||||||
| SUM PV UFCF | 5,394.2 | |||||||||
| Long Term Growth Rate, % | 2.00 | |||||||||
| Free cash flow (T + 1) | -1,861 | |||||||||
| Terminal Value | -44,364 | |||||||||
| Present Terminal Value | -32,848 | |||||||||
| Enterprise Value | -27,454 | |||||||||
| Net Debt | 21,921 | |||||||||
| Equity Value | -49,375 | |||||||||
| Diluted Shares Outstanding, MM | 1,559 | |||||||||
| Equity Value Per Share | -31.66 |
Benefits You Will Receive
- Adjustable Financial Inputs: Modify key assumptions (growth %, profit margins, WACC) to explore various scenarios.
- Real-Time Data: Pre-populated financial information for Shanghai Zhangjiang Hi-Tech Park Development Co., Ltd. to streamline your analysis.
- Automated DCF Calculations: The model computes Net Present Value (NPV) and intrinsic value automatically.
- Customizable and Professional Design: A sleek Excel template tailored to meet your valuation requirements.
- Designed for Analysts and Investors: Perfect for assessing projections, validating strategies, and enhancing efficiency.
Key Features
- Authentic Shanghai Zhangjiang Data: Pre-loaded with the company's historical financial metrics and future growth projections.
- Flexible Input Options: Tailor parameters such as revenue growth rates, profit margins, WACC, tax percentages, and capital expenditures.
- Interactive Valuation Model: Automatically refreshes Net Present Value (NPV) and intrinsic value based on your customized inputs.
- Scenario Analysis: Develop various forecasting scenarios to evaluate different valuation results.
- Intuitive User Experience: Designed to be straightforward and accessible for both seasoned professionals and newcomers.
How It Works
- Step 1: Download the Excel spreadsheet.
- Step 2: Examine the pre-filled data for Shanghai Zhangjiang Hi-Tech Park Development Co., Ltd. (600895SS), including historical and forecasted figures.
- Step 3: Modify the key assumptions (highlighted in yellow) based on your insights.
- Step 4: Observe the automatic updates reflecting the intrinsic value of Shanghai Zhangjiang Hi-Tech Park Development Co., Ltd. (600895SS).
- Step 5: Utilize the results for your investment evaluations or reporting needs.
Reasons to Choose Shanghai Zhangjiang Hi-Tech Park Development Co., Ltd. (600895SS)
- Reliability: Leveraging accurate and up-to-date financial data for informed decisions.
- Adaptability: User-friendly interface allows for easy input adjustments and scenario testing.
- Efficiency: Eliminate the complexities of constructing financial models from the ground up.
- Expert-Level Quality: Crafted with the insight and precision expected at the CFO level.
- Intuitive Design: Accessible for all users, regardless of their financial analysis proficiency.
Who Should Use This Product?
- Individual Investors: Gain insights to make educated decisions on buying or selling shares of Shanghai Zhangjiang Hi-Tech Park Development Co., Ltd. (600895SS).
- Financial Analysts: Enhance valuation methodologies with accessible financial models tailored for (600895SS).
- Consultants: Provide clients with timely and precise valuation assessments related to (600895SS).
- Business Owners: Learn how established firms like Shanghai Zhangjiang Hi-Tech Park Development Co., Ltd. (600895SS) are appraised to inform your business strategies.
- Finance Students: Explore valuation techniques through practical examples and data involving (600895SS).
Contents of the Template
- Historical Data: Contains Shanghai Zhangjiang Hi-Tech Park Development Co., Ltd.'s past financial performance and foundational forecasts.
- DCF and Levered DCF Models: Comprehensive templates for assessing the intrinsic value of Shanghai Zhangjiang Hi-Tech Park Development Co., Ltd. (600895SS).
- WACC Sheet: Pre-formulated calculations for the Weighted Average Cost of Capital.
- Editable Inputs: Adjust critical drivers such as growth rates, EBITDA margins, and CAPEX assumptions.
- Quarterly and Annual Statements: An in-depth overview of the financial performance of Shanghai Zhangjiang Hi-Tech Park Development Co., Ltd. (600895SS).
- Interactive Dashboard: Dynamically visualize valuation outcomes and projections.
Disclaimer
All information, articles, and product details provided on this website are for general informational and educational purposes only. We do not claim any ownership over, nor do we intend to infringe upon, any trademarks, copyrights, logos, brand names, or other intellectual property mentioned or depicted on this site. Such intellectual property remains the property of its respective owners, and any references here are made solely for identification or informational purposes, without implying any affiliation, endorsement, or partnership.
We make no representations or warranties, express or implied, regarding the accuracy, completeness, or suitability of any content or products presented. Nothing on this website should be construed as legal, tax, investment, financial, medical, or other professional advice. In addition, no part of this site—including articles or product references—constitutes a solicitation, recommendation, endorsement, advertisement, or offer to buy or sell any securities, franchises, or other financial instruments, particularly in jurisdictions where such activity would be unlawful.
All content is of a general nature and may not address the specific circumstances of any individual or entity. It is not a substitute for professional advice or services. Any actions you take based on the information provided here are strictly at your own risk. You accept full responsibility for any decisions or outcomes arising from your use of this website and agree to release us from any liability in connection with your use of, or reliance upon, the content or products found herein.